
Back in this post, way back in August at the start of the football season, I wrote of how I was predicting the outcome of the Premier League and would compare my predictions with the actual finishing places using Spearman Rank Correlation Coefficient.
So now the last ball has been kicked, the champions crowned and the relegated commiserated, how did I do? I fired up Excel entered my predictions and the actual finishing positions of all the teams and calculated that “my” Spearman Rank Correlation Coefficient was 0.768. 1 is perfect correlation (i.e. my predictions would have exactly matched the positions) -1 is the lowest possible correlation and would mean I had predicted the reverse of the table.
My score wasn’t too bad – I beat the BBC’s predictions – but I doff my cap to www.football.co.uk who came top in my comparisons with a Coefficient of 0.832.
Here’s how you calculate Spearman Rank Correlation Coefficient:
![]() But as ever, statistics always seems to pose more questions than it answers. Which teams were most and least predictable?
But as ever, statistics always seems to pose more questions than it answers. Which teams were most and least predictable?
I took the data I had and found the difference between their actual finishing position and their predicted finishing position. I squared this difference (to make all the differences positive) and summed these differences.
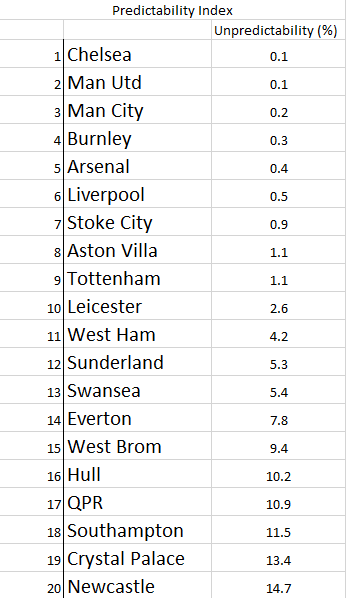
This led to an interesting alternative league table of predictability. Chelsea topped this table – most had predicted them to be Champions or runners up. Man. City & Utd also finished near the top of this league as did Burnley – most people predicted them to finish at or near the bottom, and they did. Newcastle, Crystal Palace and Southampton found themselves at the bottom of my predictability league, suggesting that they either over or under performed this season.
You can see my “Predictability Index” League below.
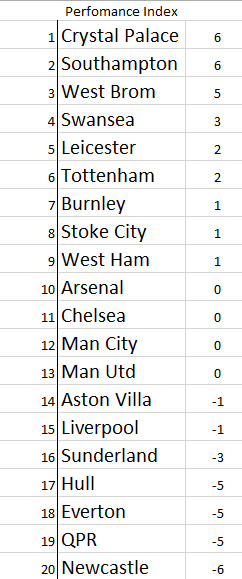
Another interesting stat to consider may be to calculate an over/under perform table -here I found the average of the difference between where a team was predicted to finish and where it actually finished. A positive number suggests a team over performed against expectations, a negative value represents under performance.
All fascinating stuff – I’m looking forward to the new season already!