Large Data Sets

image

Large data sets – not the most inspiring of titles, but one which we teachers of A Level maths will become increasingly familiar over the next few weeks and months.

A Level maths is changing, but two plus two remains four, most of the content that is in the current A Level syllabus is in the new syllabus, to be taught from September ’17. It’s place in the syllabus may have changed – i.e. a topic that currently appears in Core 3 may now find itself in AS maths and be taught in the lower sixth/first year of A Level, but there is nothing that will be too unfamiliar to today’s teacher or today’s student.

Except for large data sets.

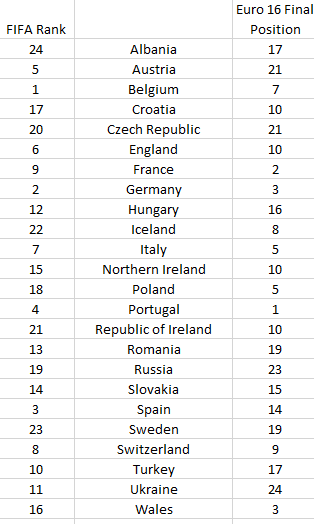
Candidates are to be familiar with one or more specific large data sets, to use technology to explore the data set(s) and associated contexts, to interpret real data presented in summary or graphical form, and to use data to investigate questions arising in real contexts.

… and that is new.

So its time to start thinking about large data sets, what they are, how we will teach with them, how they will impact on the exams…

The boards have, helpfully, published the large data sets that they will be using, and I’ve put copies of them here:

Further down this page you can see some sample questions from the boards that relate to the large data sets.

So what is to be expected of the student in the exam?

I must add a caveat that I am crystal ball gazing, and this is just my own view and not that of any board, but it seems that students won’t have to have whizzy excel skills to manipulate the data in the exam. They will be examined on this part of the syllabus like all others: in questions on paper in an exam hall, no computerisation of the exam.  They could succeed on these elements of the exam with no knowledge of how to use Excel (or any other package) to manipulate data. But, as I will begin to explore below, manipulating the data with Excel (or similar) in lessons or homework will help them develop a good knowledge of the structure and content of the data, and this is important.

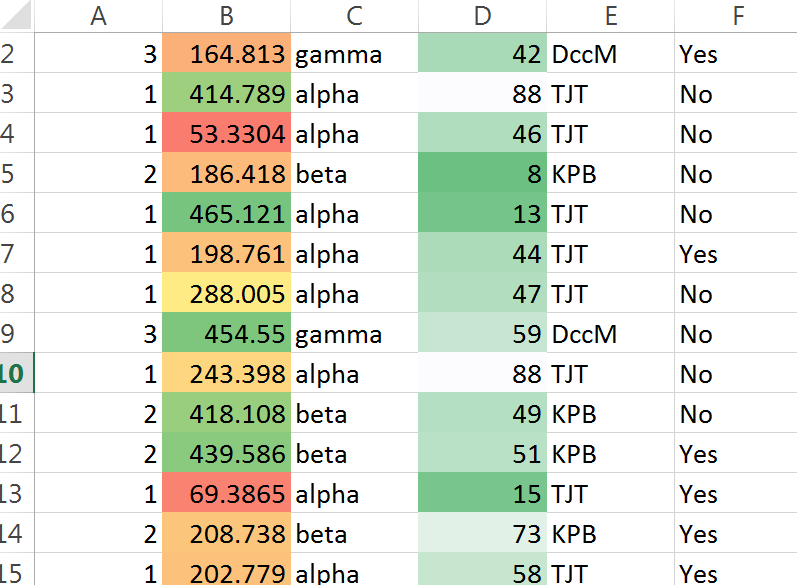
Have a look at this sample question from OCR, in particular part ii):
OCR Large Data Set Sample Question

OCR Large Data Set Sample Question

To effectively answer this you need to know that the data set contains different regions with different geographical characteristics, and the differences between, say Unitary Authority and a Metropolitan Borough and how the provision of public transport within different areas varies.  (If you don’t believe me, have read of the mark scheme below.)

I must confess, I am a little uneasy with this – are we examining mathematical skills or geographical knowledge?
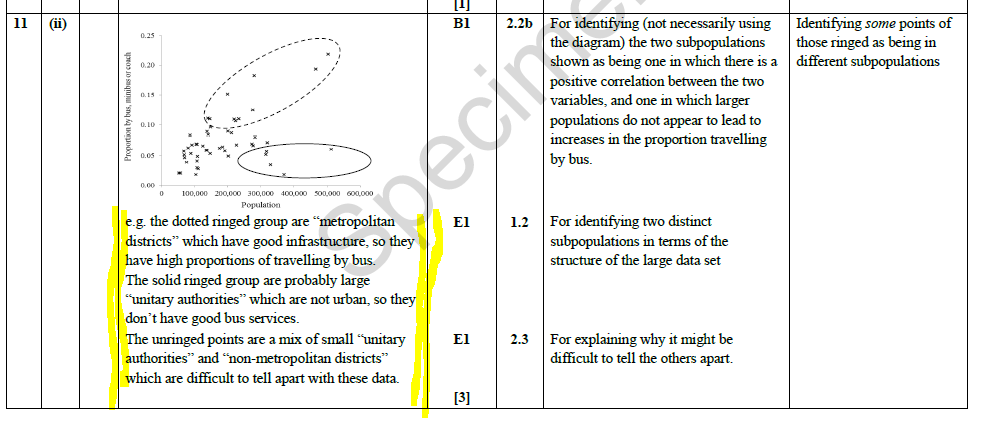
 

OCR data set sample question answer

OCR data set sample question answer

After years of staff shortages meaning Geography teachers have ended up teaching maths  it now seems that we maths teachers are going to have to do a bit of Geography teaching!

However, we must do the best for our students and so we must familirise them with the nature, structure and content of the data sets. To do this I will look at how I can incorporate them into teaching as many aspects of the syllabus as possible. For example, I will get students to calculate the Standard Deviation of all, or a sample of, the data set – and not just using the single Excel formula.  But that’s a post (or several) for another day.

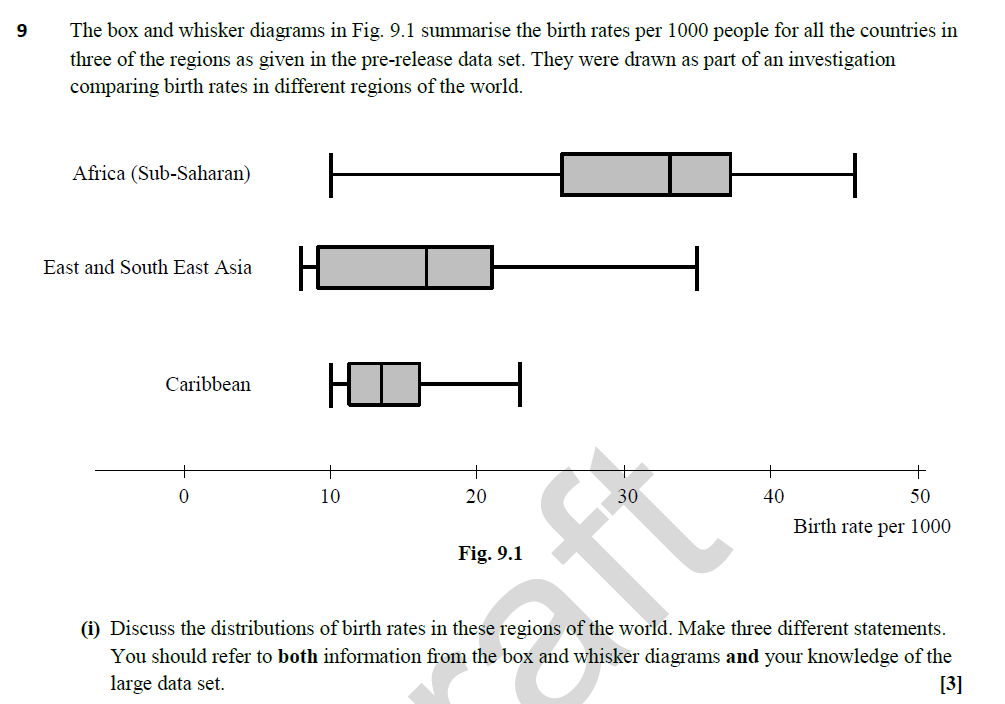
This post was hopefully a brief introduction to Large Data Sets. Download the files for yourself, have a play and a think about how you might use them.  As ever, I’d be delighted to hear your suggestions. And have a look at another couple of sample questions designed to examine the students familiarity with, and ability to explore and manipulate, large data sets.
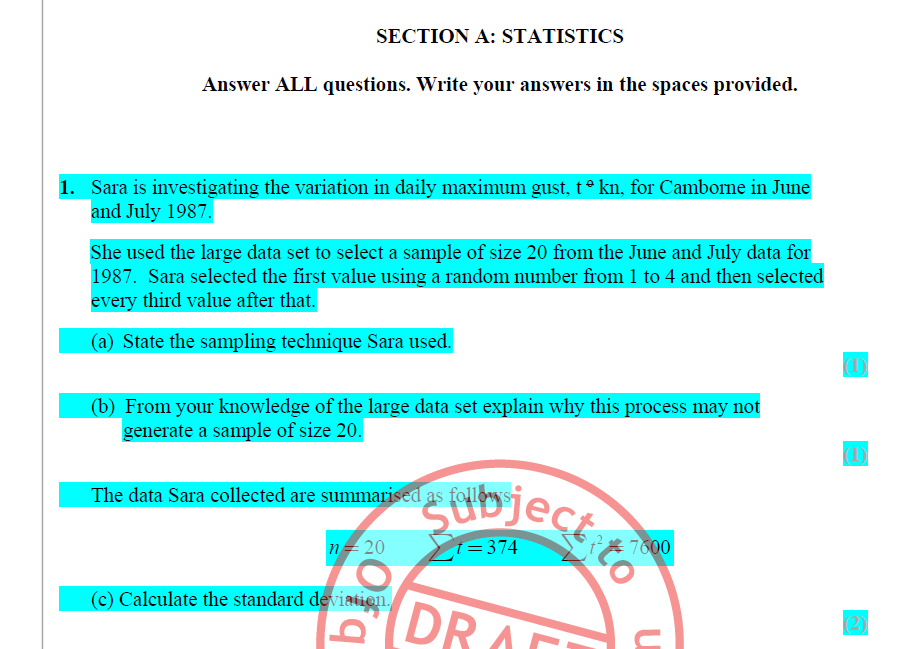
EdExcel sample Large Data Set question
EdExcel sample Large Data Set question


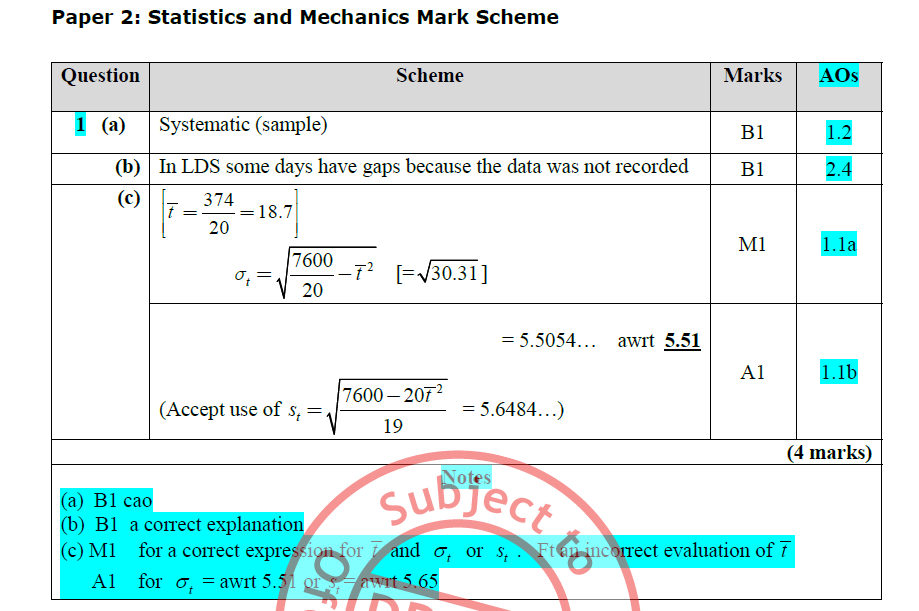
EdExcel large data set sample question answer
EdExcel large data set sample question answer


MEI Large Data set sample question
MEI Large Data set sample question

MEI Large Data Set sample question answer

MEI Large Data Set sample question answer


UPDATE 6/1/18 Click here for Large Data Sets Acitivities

Posted in Exam tips, Handling Data, Large Data Sets | Tagged | Comments closed

Pint, anyone?

pint

One of the casualties of the forthcoming changes to the A-Level syllabus is the Decision Maths module(s). The “standard” A (and AS) Level will consist of Pure Maths and a combined applied maths paper, made up of content from both Mechanics and Statistics.

I’m not sure how I feel about this – on the one hand, Decision 1 contains some really interesting maths: want to know how your SatNav determines your route? Decision 1 has the answer. Want to know how Excel sorts data? D1 explores the  Bubble Sort and Shuttle Sort algorithms, as well as explaining how to determine the efficiency of an algorithm. Plus I make a cameo appearance in the EdExcel D1 text book – my 15 minutes of fame!

But answering some (many) of the exam questions can become a little tedious, with the student forced to replicate the steps taken by a computer to use an algorithm to solve a problem.

But regardless of the above, I was delighted to discover a new application of the Traveling Salesman Problem that we study in the course.

The Traveling Salesman Problem (or TSP for short) is simple in principle, but soon escalates to become very calculation heavy.

A salesman needs to visit all the towns in his area, before returning home from where he started. In achieving his goal he wants to travel as short a distance as possible and the solution to the TSP is this route.

Imagine he only has 3 towns to visit – he has 3 choices for his first town, then 2 for his second, and only 1 for his third, so there are 3x2x1 = 6 possible solutions, although we can halve this as the length of the route ABC will be the same as CBA.

Add a fourth town and there are ½ of 4x3x2x1 = 12 different routes, five towns gives ½ of 5x4x3x2x1 = 60 – the numbers soon start getting very big and even a computer would begin to struggle to compute all the various different permutations to find the shortest route.

So we use an algorithm – in fact we use two. Its such a difficult problem that we don’t necessarily find the optimal solution. We use the “Nearest Neighbour” algorithm to find the upper bound – a distance we know that can contain a route, and then we use the Lower Bound algorithm to find the shortest what the optimal route could be. We now have a range of values between which the optimal solution must lie. If the range is small we may be happy to go with our upper bound route, if not we can try the tour improvement algorithm.

Rather than try to explain these algorithms, this short video offers a good insight into how they work.

“But you promised me a pint!” I hear you cry. “Whats all this got to do with the price of beer?”

I’m getting to that now.

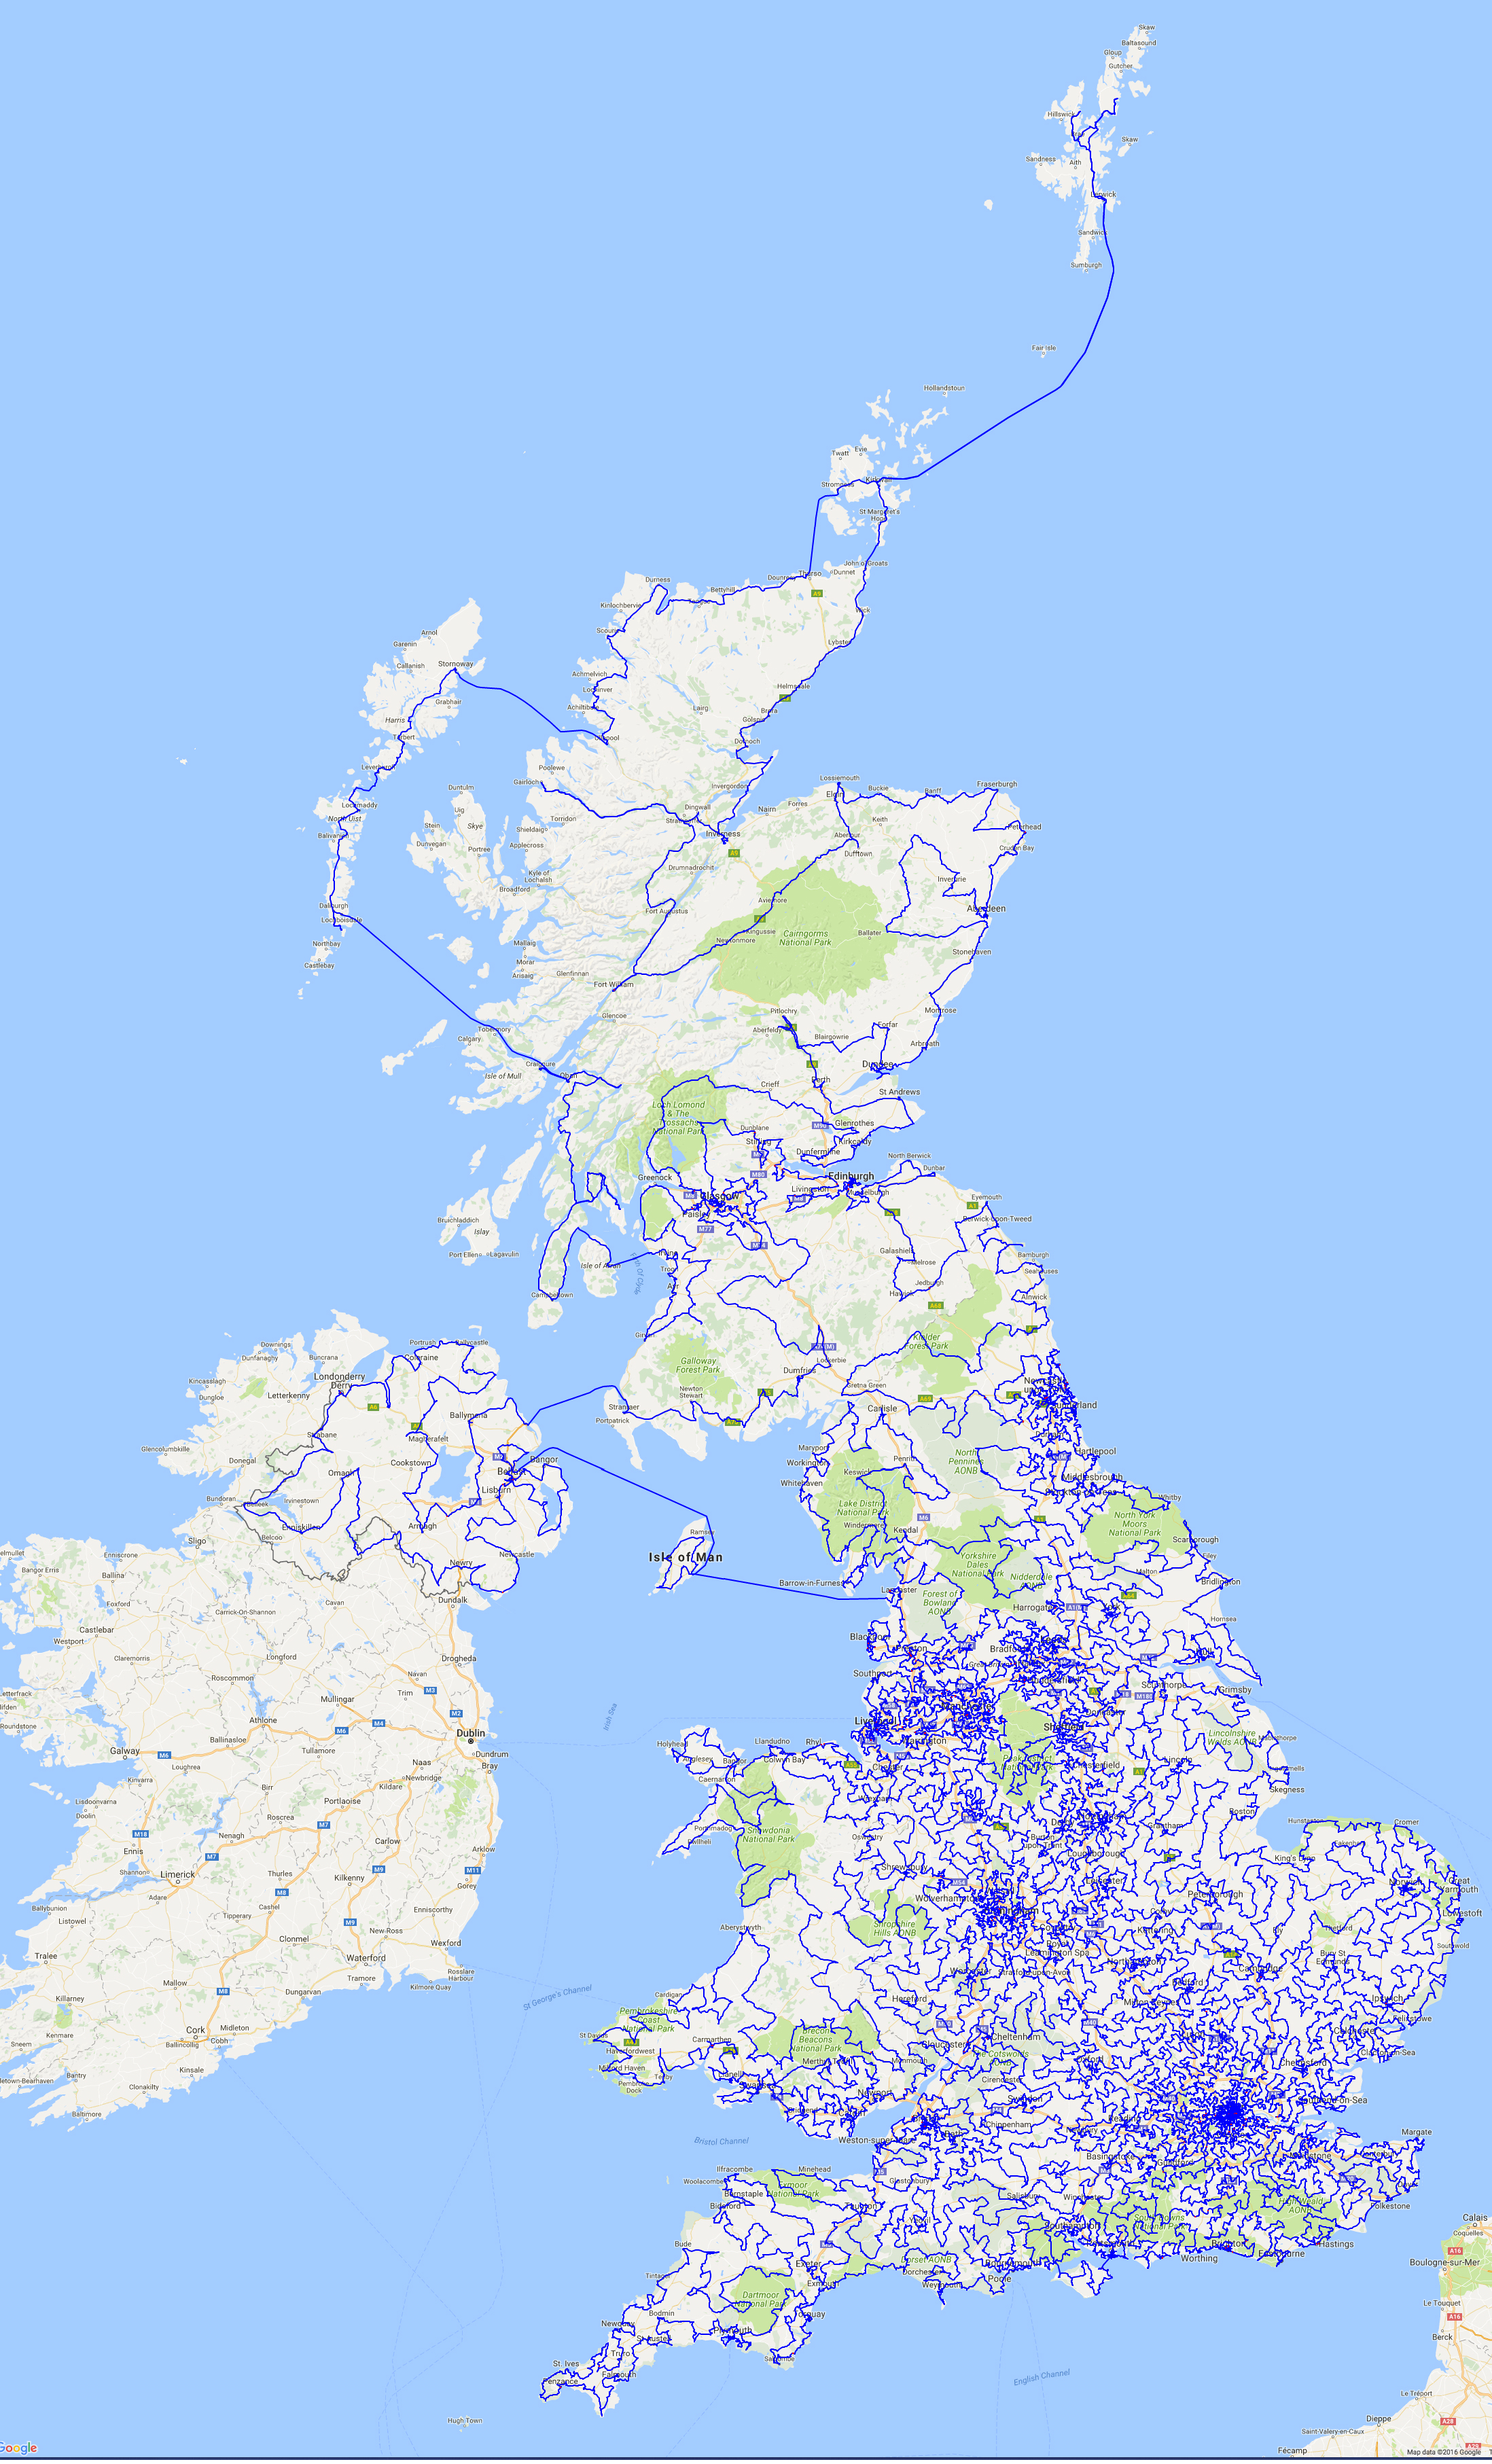
Earlier this week, I stumbled on a superb piece of mathematics that found the shortest route that would take in all 24,727 (yes – twenty four thousand, seven hundred and twenty seven) pubs in the UK.

You can read all about it here …

… or you can just enjoy the majesty of the map that shows the route:

A walking tour of the UK’s pubs. A fine application of the Traveling Salesman Problem

A walking tour of the UK’s pubs. A fine application of the Traveling Salesman Problem


Cheers!

Posted in Uncategorized | Tagged , | Comments closed

2017 – A prime year

2017-a-prime-yearIts been a fallow time for “Prime Dates” of late – the last was way back in November 2013 (a quick moments thought should reveal why there were no prime dates in 2014, ’15 or ’16) but now the drought is over, let the deluge begin.

2017 is, itself, a prime number and the year kicks off with a prime number date:

1 1 17, or 1117, is a prime number

and, with a little poetic licence, the next day, 2nd Jan, is also prime, as long as we write it as:

2 01 17

20117 is prime.  There are other primes in January, both the 23rd and 25th (23117 and 25117) are prime and there are many, many other prime dates throughout the year.

The 3rd February, 3 2 17, is both prime in its own right (3217) but is also “made” from 3 prime numbers: 3, 2 and 17

However 2017 unfolds for you, I hope you have a great year – and keep an eye out for those prime dates.

Posted in dates | Tagged , | Comments closed

5318008 …

… a tale of calculators then and now

 
boobies-901x1024

Back in my day at school, calculators in the classroom were in their infancy – I was in the last year that were not allowed calculators in their O Level maths exam, although we did use them in A Level Maths.

We thought they were pretty powerful and quite cool, although they immediately called into question why we had spent (what seemed like) weeks learning how to use logs to help with long long multiplication and division questions when a calculator could do the same problem – with no human error – in an instant.

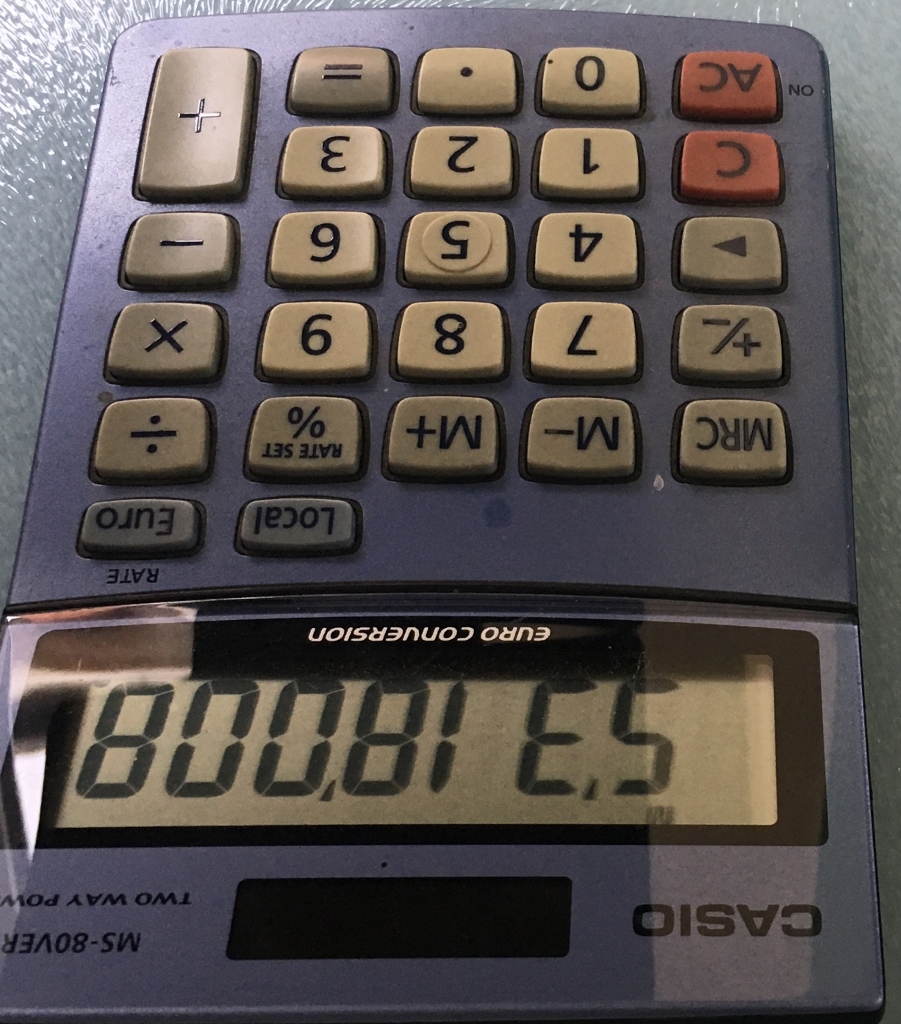
By today’s standards they were pretty basic – about the most exciting (non-mathsy) thing we could do was type in 5318008 and turn the calculator upside down for a cheap thrill and quick giggle.

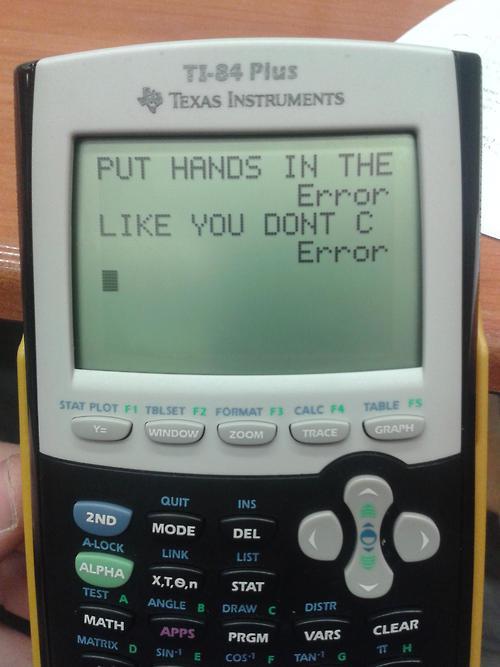
Not so today’s student, who has access to a pocket full of power. Not only have calculators moved on in the last 30 years, so has schoolboy wit and I did chuckle when I stumbled upon the image below.

The spirit of schoolboy defiance lives on. To whoever came up with this, I salute you.

hands-in-the-error


Posted in Numeracy | Comments closed

Ranking the rankings

FIFA Rank v Euro 16 position

And so, with a moth invasion rather than a pitch invasion, the Euro 16 competition has come to an end, with Portugal claiming the crown of champions with an extra time winner. Not many predicted them as tournament winners, but then that is one of the beauties of the beautiful game, its unpredictability: “Favourites win less often in football than in any other sport.”

So how did the twenty four teams involved in the competition fair compared to their official FIFA rankings?

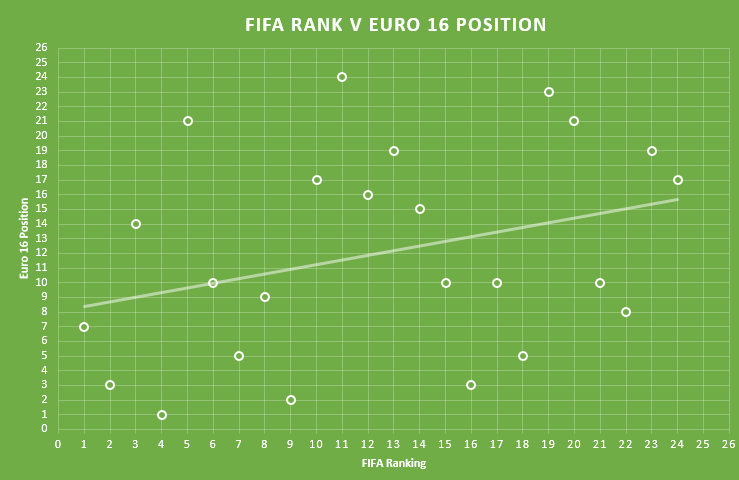
Not too well. Or more correctly, there was little or no significant correlation between FIFA ranking and final Euro 16 position.

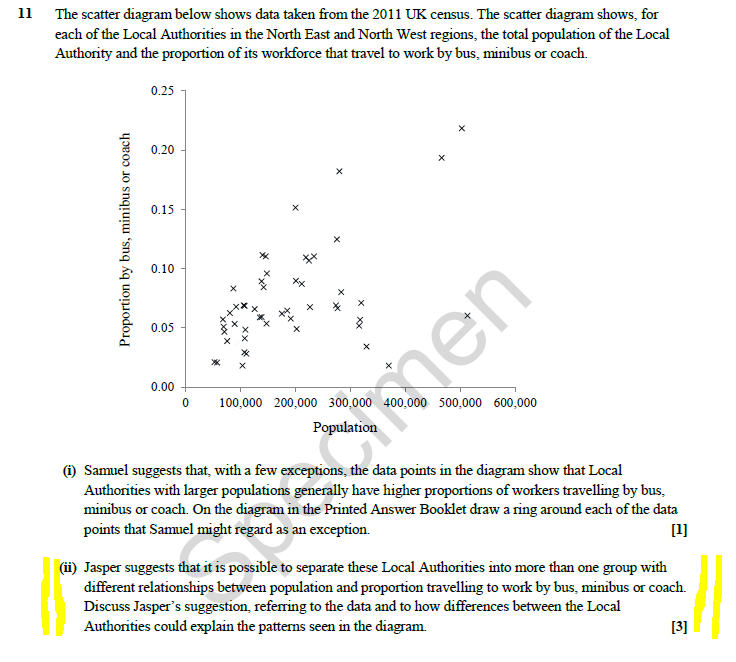
What I did is I looked at the FIFA rankings and ordered the teams in the tournament from 1 to 24 based on this. For example, Belgium are ranked 2nd by FIFA, but they were the highest ranked team in the tournament, hence I put them at the top the FIFA list. Some other interesting listings: England were the 6th best team in the competition, Northern Ireland 15th, Wales 16th and the Republic of Ireland 21st according to their FIFA rankings. Eventual winners Portugal were ranked 4th best out of the 24 teams taking part.

I then found each team’s final place in the competition. Some were obvious: e.g Portugal 1st, France 2nd etc., for teams eliminated in the knockout stages I ranked teams beaten more heavily lower than those who lost by a goal, and even lower than those who lost but took the game to extra time. For example, looking at the losing quarter finalists, I ranked both Poland and Italy joint 5th place as they both lost in extra time, Belgium 7th as they lost by 2 goals and Iceland 8th as they lost by 3 goals etc.

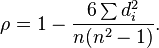
I then found the Spearman Rank Correlation Coefficient to compare the FIFA ranking and the final Euro 16 position and it came outs as 0.315

… and that’s not a lot.

It can have a value of anything from between -1 to 1 and we would be looking to get a value in excess of circa 0.65 to suggest, with confidence, that there was any meaningful correlation between the two sets of data. You can see from the graph above that we can draw a line of best fit, but the points are all someway from that line. At GCSE level maths we would draw the line by eye and would make a statement like “there is weak (or no) positive correlation.”

By the time we reach A Level maths we begin to quantify our results and Spearman Rank is one way to do it for this set of data, and we would be expecting students to make a comment on their results. (At A Level, we would use something called linear regression to draw our line of best fit.) I would expect an A Level student to conclude that there is no meaningful correlation between FIFA ranking and where a team finished in Euro 16.

So what does this mean? Are FIFA’s rankings useless?

Not necessarily. It could just be another indication of the unpredictability of football, or it could be that the rankings are useless, but more likely a combination of both, and does a tournament really tell us which is the best team? Not many pundits, players or fans would say, today, that Portugal are the best team in Europe, but they have just won the tournament. So how do we define what is the “best team”?

As ever, statistics seems to throw up more questions than it answers. But life would be boring, back pages blank and the airwaves silent if we all agreed and had nothing to discuss. And to be fair to FIFA, they will soon be publishing their new world rankings and these will include data from Euro 2016. All I can say, is don’t use those rankings to pick out the eventual winner of the next World Cup in 2018!

Spearman's rank correlation coefficient

Formula for Spearman’s Rank Correlation Coefficient

Rankings


Posted in Handling Data | Tagged , , | Comments closed