Come the revolution!

Anyone walking past my classroom of late might have come to the conclusion that I was fomenting a revolution, hearing me inciting my students to

Bring down the power!

The Head can sleep easy in his bed – I am not encouraging the students to rise up, burn their books and storm the staff room. I am merely teaching the rules of logarithms, and the power rule in particular.  You will, of course, be familiar with the rule:

log xn = n log x

but students need to be taught this, so I constantly find myself telling them to “bring down the power.”

When I do, I do like to think of myself as some sort of latter day Lenin, inspiring my students to throw off the shackles of ignorance, to rise up and seize the power that a knowledge of mathematics will bring them!!!

Lenin, calling on his students to bring down the power and submit to the Rule(s) of Logs

Posted in Numeracy | Comments closed

Large Data Sets – Activities

A year ago, I wrote this blog post, introducing Large Data Sets, a new feature to be taught on the “reformed” new AS and A level specification. Back then, it was a lot of guess work as to how best to use this new element on the syllabus, and how they will be examined in the exams.

One year on, and I must confess, I’m not much the wiser, but time waits for no man and, with much of the “pure” content having been taught the elephant in the room that are large data sets can no longer be ignored.

Helpfully, OCR have published some teaching activities for use with large data sets. They can be found by following this link. I have also uploaded the Word documents and Large Data Set and you can download the directly on the links at the bottom of this post.

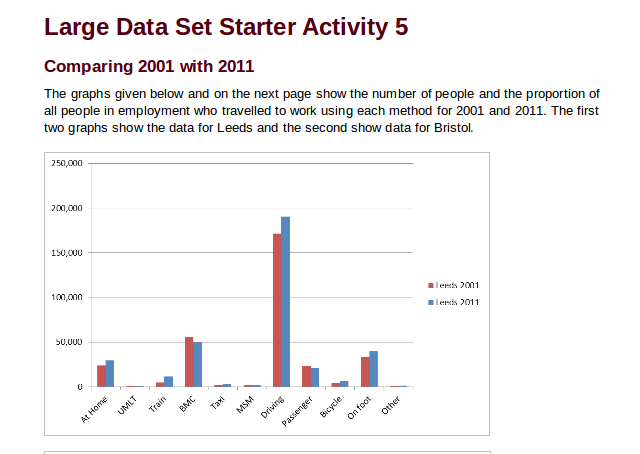
They are described as “Starter Activities”, designed to familiarise your students with the large data sets and should take circa 10 minutes per activity. Not sure I agree with this. The activities/discussion points are good – for example, in Activity 5 you might get half your class to be “Team Bristol Mayor” and argue the case for how they have successfully got commuters out of the car and travelling to work by foot or bike, and ask the other half be “Team Paxman” taking down the Mayor’s argument and highlighting car use has increased over the last decade. The statistics can be used to support both arguments and I do think that it is right that we are teaching our students how data can be – and is – used in the real world.

But be warned: these are not trivial activities that you can print out 5 minutes before your lesson – you will want to spend some time looking at the activities yourself before presenting them to the students, even if it is only to understand what the various graphs show as, for example, OCR have not labelled the axis in many cases.

They are also liberal with the use of abbreviations – perhaps this deliberate, forcing the student to consult the Large Data Set to remind themselves with what they mean, but to help you, below are a few of the more common abbreviations, and what they mean:

UMLT: Underground, Metro, Light Rail, Tram

BMC: Bus, Minibus, Coach

MSM: Motorcycle, Scooter or Moped

LDS: Large Data Set

LA: Local Authority

Download the documents:

Starter Activities 1 to 5

Starter Activities 6 to 9

Investigating Bicycle Use (Sampling Activity)

Investigating UMLT Use (Calculating from the LDS)

Large Data Set

Posted in Handling Data, Large Data Sets | Tagged | Comments closed

A Picture Paints a Thousand Words

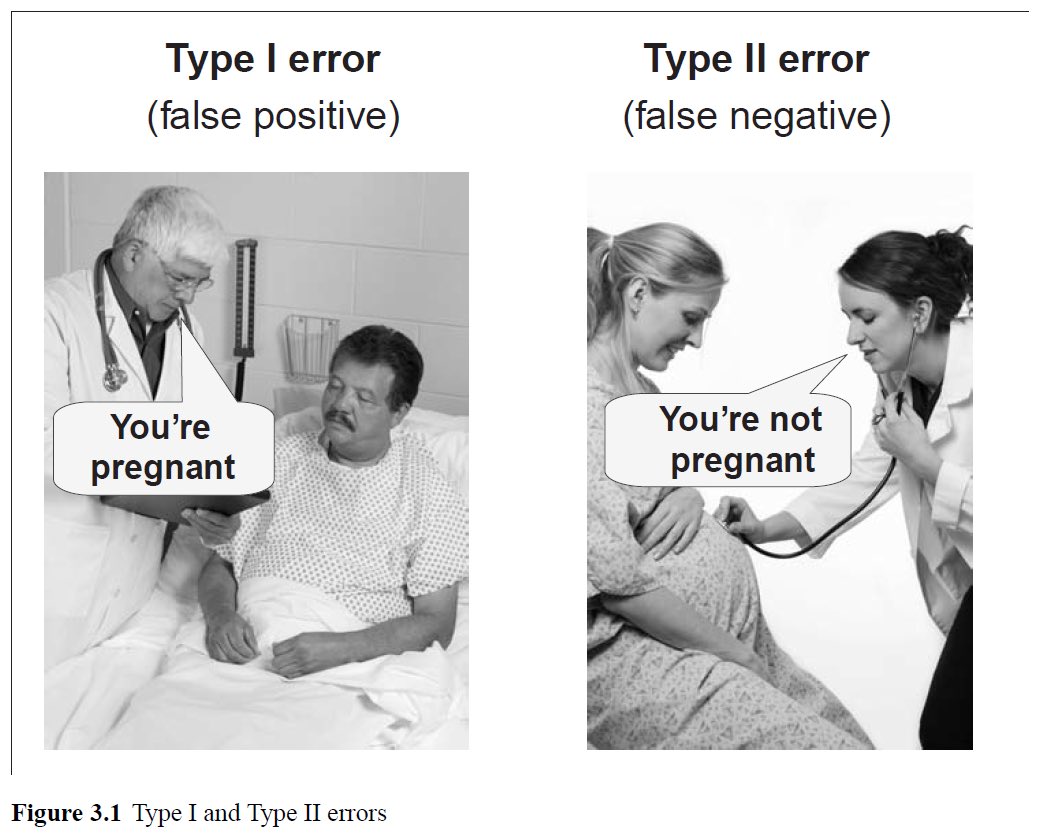
I could spend hours pontificating, explaining and lecturing and still not explain the difference between a Type I error and a Type II error as simply and as effectively as the image above. A picture really can be worth a thousand words.

Credit where credit is due: the image can be found in

The Essential Guide to Effect Sizes – Paul D. Ellis

This succinct and jargon-free introduction to effect sizes gives students and researchers the tools they need to interpret the practical significance of their results.


… a useful (and readable) book that aims to equip the reader to be able to distinguish between statisically significant and practically significant results.

Posted in Handling Data | Comments closed

University Admissions

A little over a year ago I completed my collection of 15 works of fiction.

As a tutor to fifteen Upper Sixth students I was obliged to write a glowing UCAS reference for each one, to support their application for university. My line, above, is of course, a joke – every word that I penned was factually correct, 4,000 characters painting an accurate – if positive – picture of the hopeful applicant. I did joke with my students that what I had written may well be the best thing anyone ever writes about them – my aim was to make each and everyone one of them appear an attractive prospect for the universities to which they were applying.

It was no mean feat, if only in terms of time. If I spent only an hour on each, then it would have added an extra two working days to my load; a more realistic three hours per student – including time to discuss them with their subject teachers, draft my reference, proof read it, upload it etc – would add an extra working week to my “normal” teaching load.

And I couldn’t help but wonder how much emphasis the universities would place on my wordsmanship.

It seems no-one (other than the institutions themselves) know.

The Sutton Trust has today published a report looking at universtity application and admissions, and it makes interesting reading. The report looks at three areas:

  • The UCAS form
  • The Predicted Grades system
  • Personal Statements

… so not teacher references, but relating to personal statements the report does state:

They have different approaches to the use of contextual admissions and apply different criteria when analysing personal statements.

so it is reasonable to assume that different criteria will have been applied to my references by different universities – some may have read them, some may not. I have no way of knowing if my efforts were of use, or simply vanished into the ether, never to be read by anyone but me.

The Sutton Trust’s report is quite damming of the admissions process and as a teacher/sixth form tutor and a parent (my Year 13 daughter (at a different school) has been applying to University this term) I agree with them.

The goal of the Sutton Trust is to improve social mobility and, in its report, has focused on the challenges faced by poorer and disadvantaged. My students certainly don’t fall into that category so, by implication, they benefit from the current system, but I think that they, too, would benefit from a leveling of the playing fields.

At the heart of the fallibility of the current system are predicted grades. Applications are made, and offers given, well before students sit their A level exams and so predicted grades – not actual grades – form the central pillar of the process. The Sutton Trust correctly argues that those students from disadvantaged backgrounds are less likely to have pushy parents picking up the phone to demand that their child’s predicted grade be raised.  If the student doesn’t have high enough predicted grades, they won’t be made an offer.

The predicted grades that I give are aspirational – a grade to aim for, but one that may ultimately prove to be beyond the reach of the student. I am not alone in this, the report states:

Evidence shows that the majority of grades are over-predicted, which could encourage students to make more aspirational choices.

Other than in exceptional circumstances, a student shouldn’t do better than their (university) predicted grade, otherwise we’ve done them a disservice and, possibly, shut an educational door on them that should have remained open.

However the report tells us:

However, high attaining disadvantaged students are more likely to have their grades under-predicted than their richer counterparts. This could result in them applying to universities which are less selective than their credentials would permit.

It goes on to tell us that circa 1,000 students each year have their grades under-predicted.

There is, of course, a way, a simple way, to overcome this problem:

Don’t allow pupils to apply to university until they have their grades.

Once you know you have three As, or two Bs and a C, you can then, with confidence, apply to the university and course for which you have made the grade. No more opaque applications, no more unfair predicted grades, no more clearing, just a simple, straight forward and transparent admissions system.

The educational calendar my have to be “tweaked” to make this work, to give universities and students time to make to make their choices – or perhaps not, thousands of students get their results in mid-August, go through clearing and then pack their bags ready for a September start. Or, my big idea, start the university year in January: students finish their exams in July, giving them 5 months to work/travel/grow up before starting university, with a brief punctuation in August to make their application.

Perhaps I can leave the last word to Sir Peter Lampl, founder and chairman of the Sutton Trust:

“Access to leading universities has improved and they are working hard to attract a wider applicant pool.  However, the brightest disadvantaged students, given their grades, are under-represented at leading universities. The admission process itself may be responsible for this.

“Accordingly, the Sutton Trust is recommending we move to a post-qualification applications system.  This is where students apply only after they have received their A-level results.  This does away with predicted grades.  Having actual grades on application empowers the student.  They can pick the right course at the right university with a high degree of certainty they are making the right choice.

“Additionally, we are recommending using contextual data in admissions.  Also, the format of the personal statement should be reviewed to see how it could be improved and how it could become more transparent.”


 

Posted in Uncategorized | Tagged , | Comments closed

Adding and Subtracting Fractions

Subtracting Fractions

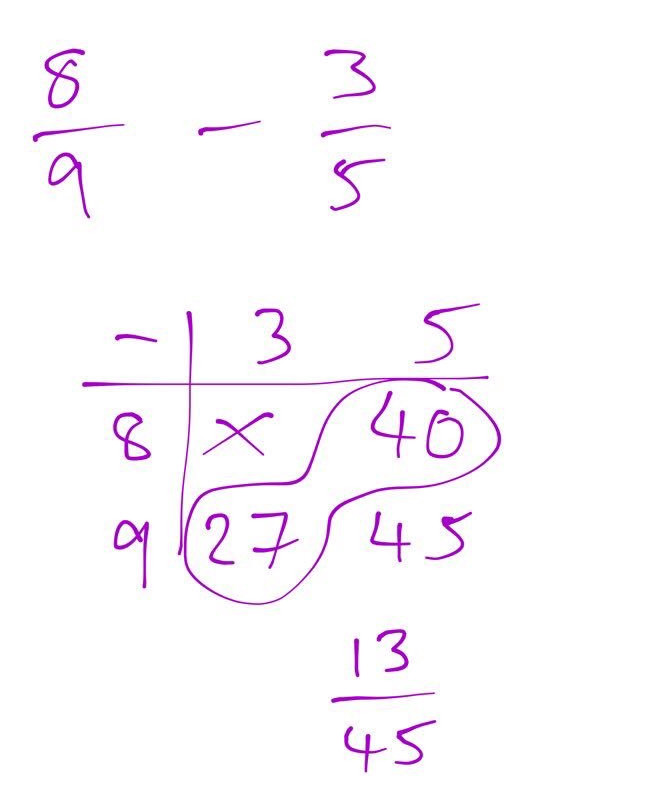
Over on Twitter, @missradders has sparked a really interesting discussion on subtracting fractions by offering the above method to subtract two fractions.  (see the Twitter thread here)

I must admit, it is a method new to me and, from reading the replies to her tweet, it was unfamiliar to many other teachers, to.

But is it a valid method?

Again, reading through the comments on the thread, its taking a bit of a kicking. Before we come to a conclusion, perhaps its worth asking why, in the age of the scientific calculator, do we even bother to add or subtract fractions?

Beside me on my desk, I have the new(ish) Casio Classwiz fx-991 EX calculator, that will integrate, solve cubic inequalities, handle matrices – adding and subtracting fractions are well within its capability: what is the point of asking recalcitrant pupils to manually perform an algorithmic task that can be done electronically in moments?

The answer is algebra.

Being able to add or subtract – mentally, or on paper – straightforward fractions such as, say 3/1/ has it’s merits, but I would be reaching for my aforementioned fancy calculator to do the subtraction at the top of the page: 8/3/ but I need to know how to do it with numbers as it is the stepping stone to being able to work algebraically.

High end GCSE – and all A level – mathematicians need to be able to work with algebraic fractions and being secure with a method of adding and subtracting numeric fractions is crucial for this skill.

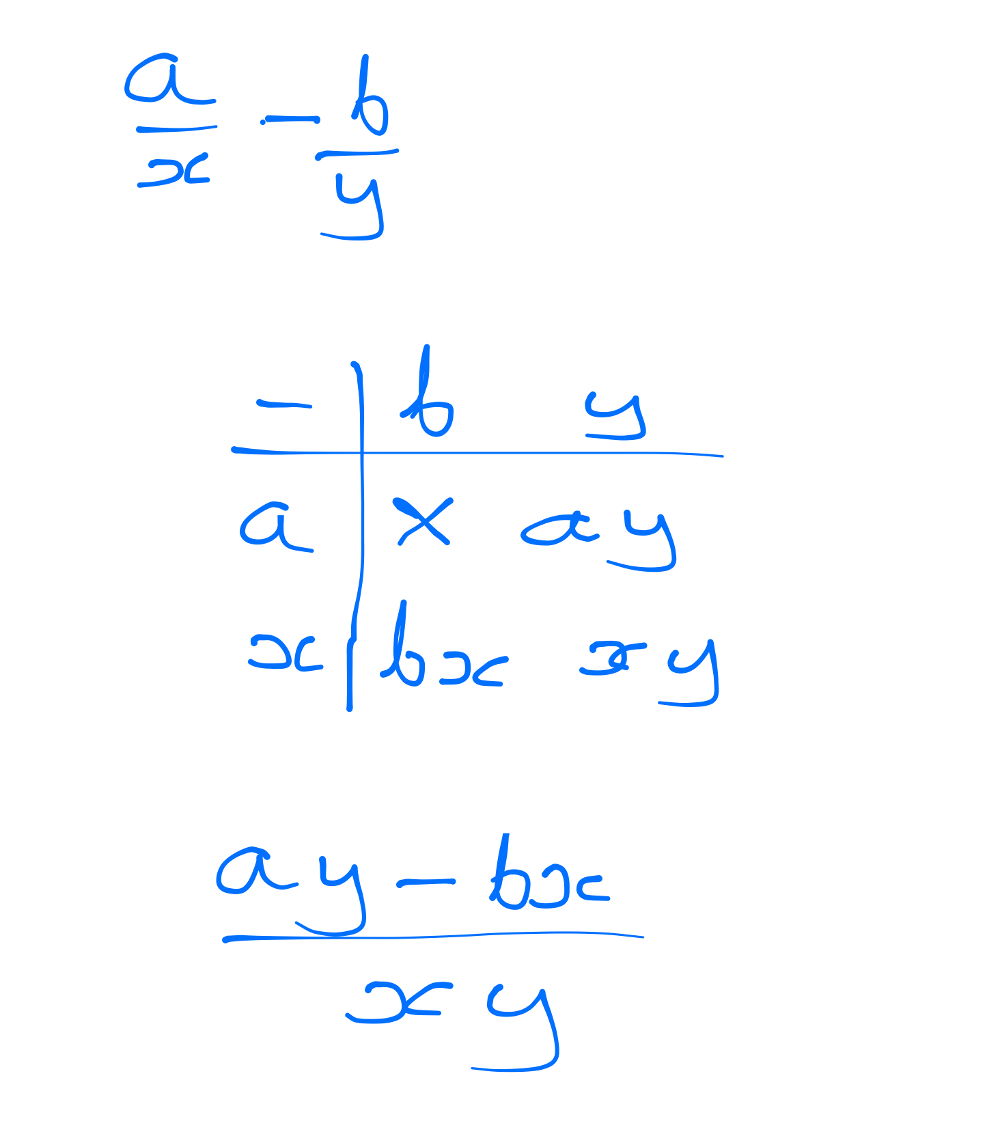
So the test of @missredders method is to see how well it works with algebraic fractions. So I tried it to subtract the fractions: a/b/, my working is below.

Subtracting Algebraic Fractions

It works. In fact, I think it helps to see the method in algebraic form as it explains why it works.

I don’t think that it is a method that I will be teaching (but happy to keep it in my armoury, just in case) but I don’t think that it is the dog’s dinner that some are claiming on Twitter.

As a method it works, and there is a clear route from using the method numerically to using the method algebraically, and that is important. I suspect that if a student is taught the “grid method” shown at the top of the page, masters it and goes on to use it algebraically for higher level maths, they will probably develop their own shortcuts for using the method (i.e. going straight to writing down the common denominator) and that – find short cuts – is what maths, and being mathematical, is all about.


Posted in Algebra, Numeracy | Comments closed