The Six Nations Rugby – my sporting highlight of the year.
Each year, the six nations – England, Ireland, Scotland, Wales, France and Italy – play each other once in a round robin Rugby Union Championship. The rivalry, as it so often is amongst neighbours, is intense, the rugby passionate and the outcome is never a forgone conclusion.
And, like most sports, rugby lends itself to a bit of mathematical analysis.
In rugby union there are three different ways to score:
- A penalty is worth 3 points
- A try is worth 5 points
- A converted try is worth 7 points
So what, if any, scores are impossible to get in rugby? Hopefully you can quickly spot that 1, 2 and 4 are the only scores a team can’t get in rugby union. (Rugby League is a different code of the game, with a different scoring system. For simplicity, from now on when I write “rugby” I will mean rugby union.)
But can you prove that you can get every possible score above 4?
Mathematical proof is often seen as ‘hard’ by pupils, but they may well be able to come up with an intuitive proof for this problem:
As soon as you can show how to make three consecutive scores, you can prove all others are possible as a penalty is worth three points and you can add a penalty on to the three consecutive scores to get the next three consecutive scores etc.
E.g. lets say P = penalty (3 points) T = try (5 points) C = converted try (7 points)
to make three consecutive scores we could have:
we could then add a penalty to each of those scores to get the next three consecutive scores:
- 8 (T + P)
- 9 (x2P +P)
- 10 (C + P)
and to get the next three consecutive scores, add another penalty etc. So we have proved that you can score every possible score in rugby, above 4 points.
So what is the most likely score?
A great question that bookies, gamblers and pundits alike all would love to answer – and a great question to try and solve (either yourself or as a challenge for your pupils.)
We know that the only possible individual scores are 3, 5 and 7, so “all” you need to do is work out how many different ways you can make a number from those adding those numbers.
There is only one way to make to make the scores up to 9, but there are two ways to score 10 points – a penalty and converted try, or two (unconverted) tries – but there is only one way – 2 penalties and a try – to make a score of 11, so we would expect a team to score 10 points more often than 11 points.
(I’m considering combinations, as the order of scoring is unimportant. e.g. Penalty, Try, Penalty is the same as Try, Penalty, Penalty. When the order is important it is a permutation.)
Its an interesting investigation to work out how many different ways there are to score up-to, say, 20 or 30 points, to maybe give you an edge when predicting the outcome of a game of rugby.
With so many different scores possible, it is notoriously hard to pick the final score of a game of rugby. If you read the press, the pundits don’t do it, instead predicting the winners, and the margin of victory, e.g. England to win by 5 points, Wales to win by 10 etc.
Which leads me to think, is there a differential that is more common than others?
Perhaps we could work that out by looking at the most likely scores, or doing some statistical analysis of previous games, but that is a problem for a different day. As half-term draws to a close, I’m looking forward to settling down in front of the TV and watching England v Ireland.
Oh, and my prediction? England to win by 3.
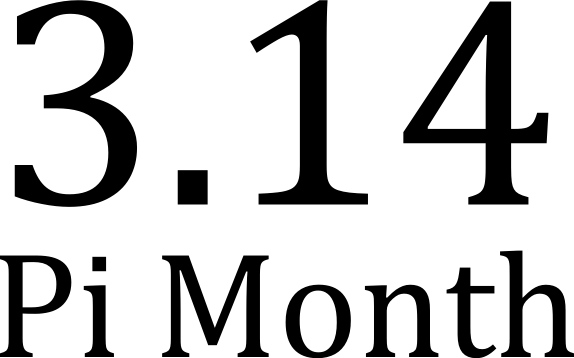 The Americans have their Pi Day later this month – March 14th – 3.14, as they write the month then the date.