(American) Pi Day

Happy Pi Day!

In the UK, we write the date in the Day/Month/Year format, but our American cousins write the Month then the Day so, whilst we would write today’s date as 14.3.13, in America it is written as 3.14.13 or Pi Day as Pi (to two decimal places) is 3.14.

In two years time it will be even more exciting as the year will be 2015, meaning the date (in the American format) will be 3.14 15 – that’s the first five digits of Pi.

And it gets better than that!

Pi to four decimal places is actually 3.1416, as Pi is 3.141592653 …,  the 9 after the first 5 causes it to be rounded up to 6.

So not only can we celebrate a special Pi day on 14th March 2015 (3.1415), we get to celebrate a special Pi day the following year 14th March 2016 (3.1416) as that is Pi rounded to four decimal places.

But we plucky Brits have our own special day – approximate Pi Day, the 22nd of July as we write the date 22/7 and, as any schoolboy or girl will tell you, 22/7 is a pretty useful approximation for Pi.

So enjoy the day, and if you missed it, don’t worry, its no too long until July!

And as a Pi day treat, here’s a video of someone trying to calculate Pi using, er, pies.


Posted in dates, Shape and space | Tagged | Comments closed

Why we teach

Let x = 0.222 ...

On Friday, after lessons, a pupil came to find me. I don’t teach him this year, but have done so previously and I know him to be particularly interested in the subject and we often chat about what he’s currently studying in maths.

He sought me out for some help with a problem he had encountered: write 0.2 recurring as a decimal.

So we grabbed a scrap of paper and pencil and ‘did the math’ as they say in America:

Let x = 0.2222 … recurring

Multiply x by 10 to give:

10x = 2.222…

Now subtract x from 10x:

 10x = 2.222 …

 – x = 0.222 …

 9x = 2

So 9x = 2, therefore

x = 29

I’ve always found this a neat little piece of maths, and my student did too.

And that’s two reasons why we teach:

  1. We get to use maths on a daily basis, and still get a buzz out of its simple brilliance.
  2. Sharing that knowledge with young people and helping them make sense of the world around them.

A great way to end the teaching week!

Posted in Algebra, Numeracy | Comments closed

Measure, and measure …

… and measure again.

Shatter Proof Ruler

As discussed in the last post, we live in the “Information Age”. With so much data available to us, its easy to drown in an information overload and so, more than ever, we need to think about how we display that data.

Below is a short video – less than three minutes long – that is a brilliant example of how data can be used to both illustrate and illuminate.

The message of the video is hugely important – and hugely encouraging – but I’d like you to focus on the brilliant way that the data is displayed. I can spot four – or is it five? –  different variables: can you see them too?

“It is only by measuring that we can cross the river of myths.”

Watch the video – you’ll enjoy it and be enlightened by it – the power of information.


Posted in Handling Data | Comments closed

Birthdays are good for you …

Birthdays are good for you ...… a recent scientific study has shown that those that have the most birthdays tend to live the longest.

(but those with fewer birthdays tend to be healthier and fitter)

Of course it makes sense, but it also highlights the need to be careful, very careful, with statistical information.

As a maths teacher, I am always being asked “What’s the point of this?” “When will I ever use this in real life?” etc. I can usually always find a practical example of where the maths we are studying is used in the world outside the classroom. (Although I do always ponder what answers Geography teachers give to similar questions. Why do we need to know how an Oxbow lake is formed? 🙂 )

The teaching, understanding and application of Handling Data (that’s statistics to those of us of ‘an age’) has never been more important than it is now. We live in the age of data. How do Facebook, Google et-al make their money? By gathering and selling on data.

We all owe it to ourselves to understand the data that is presented to us, whether that be by the media, politicians, advertisers, lawyers … the list is endless. And they will spin that data to their own advantage, so we need to be able to interpret and understand that data for ourselves and draw our own conclusions, not necessarily the conclusion they want us to reach.

Here’s a really simple example. When someone talks of ‘the average’ what do they mean? Probably just that – the mean, but the mode (the most common number) and the median (the middle number) are also technically ‘averages’ so it may just suit someone to talk about the average, but use the mode, rather than the mean, for their advantage.

Lets say a class of children did a test, marked out of twenty.  These were the marks of the 5 pupils (it wasn’t a big class!)

8, 8, 9, 16, 19

So what’s the average mark? Well, traditionally, the ‘average’ is taken to mean the mean, so lets calculate the mean:

8 + 8 + 9 + 16 + 19 = 60  60 ÷ 5 (as 5 pupils did the test) = 12

So the average is 12 and 3 children would have to go home and tell mum and dad that they scored below average.

But being mathematically astute, they know that the median and mode are also averages.

In this case, the median is 9 (middle number) and the mode is 8 (the score that appears most often). For the pupils, in the case, the mode is the best average for them to quote: two children can go home saying they scored the average mark and the other 3 can all claim to be above average.

This is a simple, somewhat tongue in cheek example, but it neatly highlights how data can be presented in different ways to suit different purposes. You have been warned!


If you’d like to (or your child to!) practise calculating the mean, mode and median of a set of numbers, you can find a mean mode median and range worksheet at my Worksheets page. At the time of writing, this page is still under development, but I have made a useful mean mode median and range worksheet that is good to go – you can go directly to it by clicking here.

 

Posted in Handling Data | Tagged , , | Comments closed

Palindromic Numbers

Today is a palindrome.

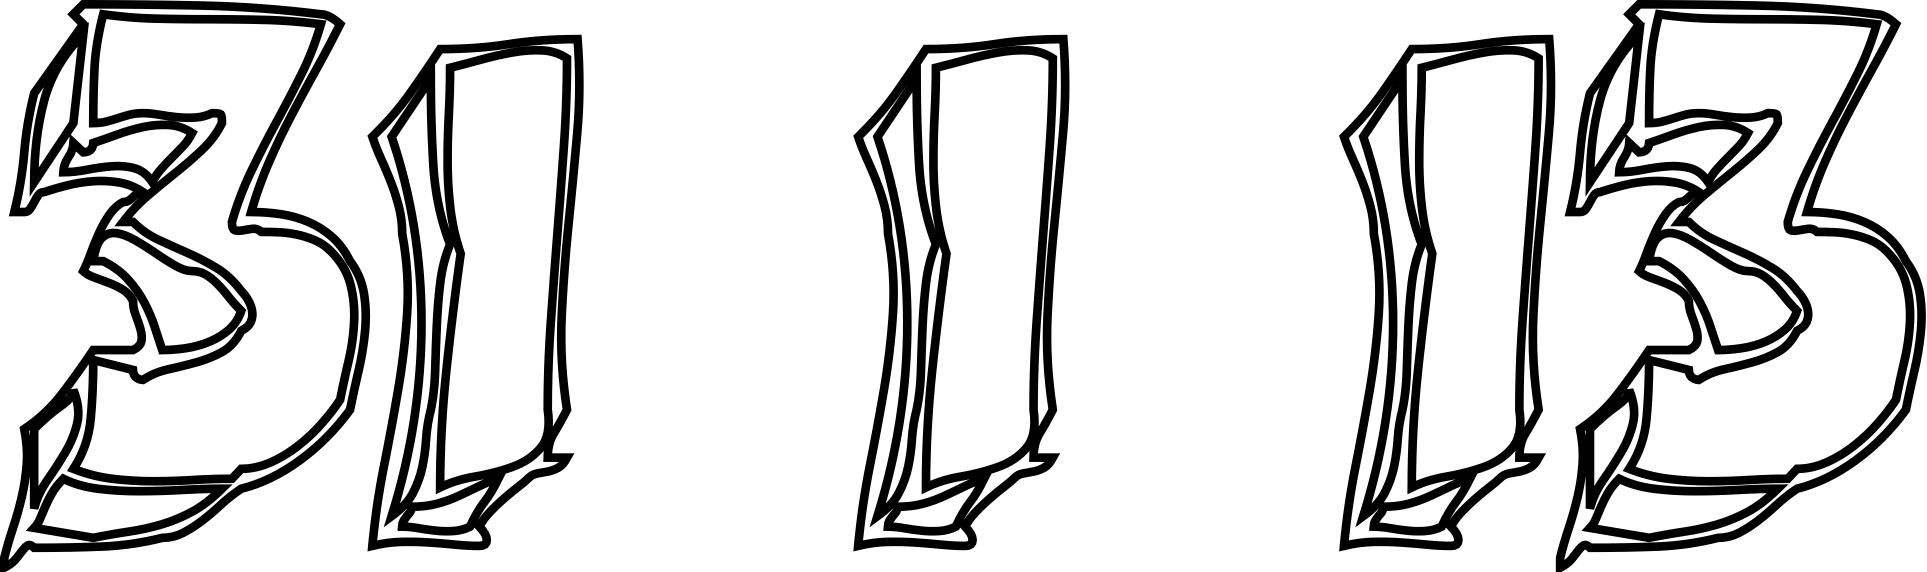
Look at today’s date: 31 1 13

Its the same forward as it is backwards.

There’s quite a nice little investigation you can do with numbers:

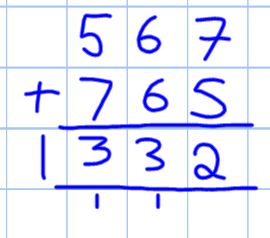
Take any 3 digit number – say 567. Reverse the digits -> 765 and add them together.  Is the answer “interesting”? (In this case “interesting” means palindromic – the same forward as it is backwards.)

567 + 765


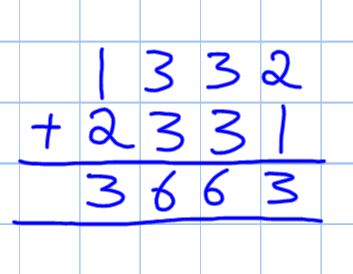
If not, take the answer, reverse the digits, add the two numbers together, and see what happens.


1332 + 2331

Will it work for all 3 digit numbers? What about 2 digit or 4 digit numbers?

At one level, this is a great little investigation to practise addition, but it can prompt so many other questions like those above, and more, like when is the next palindromic date? How many can we look forward to this year? What about next year? As ever, we seem to end up asking more questions than we answer, but isn’t that what makes maths so much fun?

Enjoy the day and have a play with some palindromic dates and numbers.

Posted in dates, Numeracy | Tagged , | Comments closed