Golf – Its just A Level Maths

GolfAnd so the superb summer of sport rolls on. We’ve had the women’s success in the football World Cup, watched some sublime rallies at Wimbledon and thumped the Aussies to secure the First Test in the Ashes series. Now our attention swings northwards to St. Andrews, Scotland, for the Open Golf Championship.

Golf, despite what they’d have you believe with their birdies, bogeys, niblicks, yips and eagles, is really a such a simple, straight forward sport, well within the capacity of anyone doing A Level Maths.

Newton’s First Law tells us:

An object either remains at rest or continues at a constant velocity unless acted upon by an external force.

So picture the scene, the crisp white form of an unblemished golf ball highlighted against the perfectly manicured green grass of the first tee. The only thing that is going to make that ball move – the external force of Newton’s first – is the head of the golf club as it strikes the ball, and this contact is so momentary, certainly less than a second in length, but it is this moment that is the difference between success and failure.

Lets look at that “moment” (of contact) in a little more detail.  In the Mechanics 1 (M1) module, we learn that:

Impulse = Force x Time

and also:

Impulse = Change in momentum

So to increase the impulse (force x time) we can either increase the force or the time (that the club is in contact with the ball), or both.  Why do we want to increase the impulse? The impulse of the club on the ball is the same as the impulse of ball on club. The initial velocity of the ball is zero, so the initial momentum of the ball is zero, so the impulse is equal to the final momentum of the ball, and momentum is mass x velocity. The mass of the ball is constant, so the bigger the impulse, the higher the velocity of the ball as it leaves the tee, the higher the velocity the further it goes.

Still with me? Good!

So to increase the force the golfer has to swing the club faster as force = mass x acceleration

To increase the time the golfer has to keep the club in contact with the ball for as long as possible – this is what follow through is all about, keeping ball and club together for as long as possible, to increase the impulse on the ball.

And once the ball leaves the club, the only external force acting upon it is gravity, and the problem becomes a straight forward SUVAT question (we can work out its initial velocity as it leaves the club as we know the impulse, hence the momentum, and momentum equals mass x velocity.)

But what about when the ball fades to the right or draws to the left? To change direction some external force must be applied. This can only occur if the ball is rotating as it flies through the air, creating a pressure differential on either side of the ball. I admit – we are now into Bernoulli’s Principle and some undergraduate level aerodynamics. Perhaps that’s a topic for another post, another day.

The only other thing the golfer can control is the direction of the ball which will be determined by the direction of the clubhead when the ball ceases contact with it.

So, its all pretty simple, basic A Level maths. There are only three variables that dictate where the ball goes:

  1. The speed of the club as it strikes the ball
  2. The length of time the club is in contact with the ball
  3. The direction of travel of the club as it is in contact with the ball

Three little things that take place in the blink of an eye. But it does raise one very important, challenging question:

If its so simple, how come the ball never goes where I want it to when I play the blommin’ game?
 

Posted in Uncategorized | Tagged | Comments closed

One in Four?

Sir Michael Wilshaw, the head of OFSTED, claimed yesterday that …

One in four – a quarter – of leaders in secondary schools are not good enough

… and that got me thinking about the Heads that I’ve served under in my time in the classroom.

I’ve worked for seven different Head Teachers, most have been very good, one was truely awful, so not (in my experience) quite the bleak picture that the Chief Inspector paints, but certainly “could do better.” (Forgive me, it’s report writing season.)

What does irk me is the word “leadership” and how it is now so freely bandied about within schools.  I spent the first five years of my working career as an Officer in the Royal Air Force. The military does “leadership” better than anyone – it has to, if you want people to follow you “over the top” you’ve got to lead them in every sense of the word. As a young man I was lucky enough to receive excellent leadership training at RAF College Cranwell (although it is, perhaps, only thirty years later that I recognise how good it was) and then be exposed to, and worked with, excellent leaders in “the real world” (if a front line RAF squadron can ever be described as “the real world.”)

It is no surprise to me that, on average, the standard of leadership I see in schools is not as high as it was in the Air Force. In every branch of the military, leadership celebrated, coached, developed and prized at every level, from the private Tommy right through to General Melchett. In schools, if you are good in the classroom one day, you can find yourself Head of Department the next. Rinse and repeat a few times and suddenly you wake up to find yourself “leading” a school and whilst you may be a whizz at manipulating data no-one will have ever schooled you in the art of leadership.

The ironic thing is is that the ‘bad’ Head I worked for was the one who insisted that the Senior Management Team be re-branded as the Senior Leadership Team, yet he couldn’t lead a horse to water and micro-managed everything to a stand still.  He loved the idea of leadership, and being a leader, but he was so engrossed in talking the talk that he never managed to walk the walk. Leadership is not easy, and it is a whole lot more than a few words and a motivational slogan pinched from Facebook.

In the military, leadership is all about empowering and enabling the man or women at the front line to do their job to the very best of their ability. And this is what I would like school leaders to take notice of. It is your teachers in the classroom that are going to implement your behaviour policy, that are going to deliver you the results you desire, that are going to turn your visions into reality – what are you doing to “lead” them? If you are a school leader – at any level – ask yourself that question and you’ve taken the first step; answer it and you are on your way to becoming a great leader.

Posted in Teaching Tips | Tagged | Comments closed

Percentage Soup

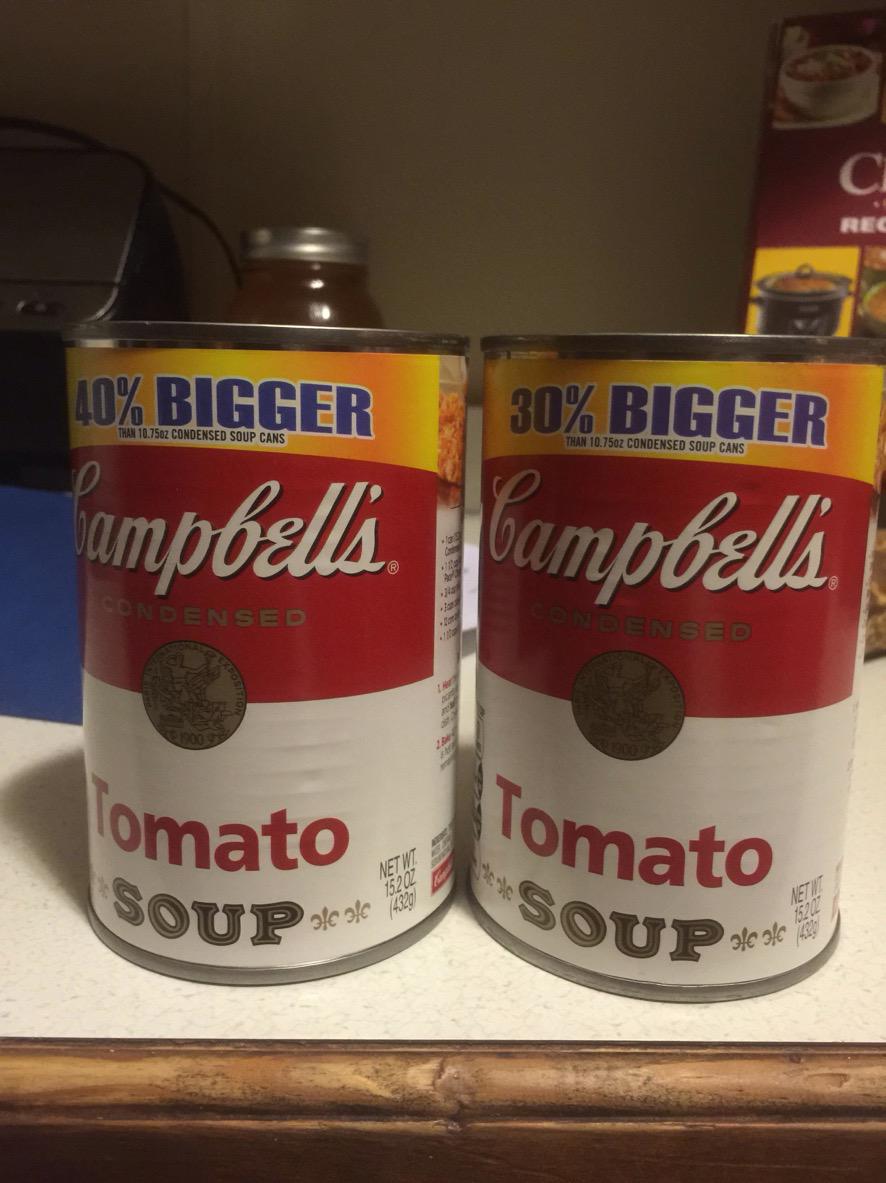
Percentage soupOops! Looks like Campbells have got themselves in a bit of a pickle over percentages.

They can’t both be right, so which is it 30% or 40%? Shall we “do the math” as they say in America.

Old size times (1+x) = New size, where x is the percentage increase in decimal form.

A quick bit of re-arranging gives us:

1 + x = New size/ Old size

x = (New Size/Old size) -1

Multiply x by 100 to turn it into a percentage.

x = (15.2 / 10.75) = 0.41 …

So the 40% can is about right.

Another maths fail to add to the collection.

Anyone fancy a some soup?

(Image first seen (by me) here)


Posted in Maths Fail | Tagged | Comments closed

Perceptions

13 Star

Quick – before you read any further – look at the picture above and describe it in no more than three words.

In August this year I’ll have been married, happily married, for nineteen years. However, despite living with the same lady for so long it appears that we still see things very differently.

We are (hopefully) moving house soon and are busy packing and making plans for our new home. I asked my wife what we were ” … going to do with the number thirteen?”

She looked at me, perhaps not blankly, more of a “what are you talking about, you fool?” type of look. (Over the years I’ve become accustomed to it.)

“Our number thirteen, what are we going to do with it?”

“What are you talking about?” she quizzed, completely perplexed at what I was asking.

“Our big red number thirteen” I replied.

“The red star? It’s a star. Who’d describe it as a number?”  her withering response as she finally realised what I was talking about.

To me, I’ve always thought of it as a number – perhaps that’s why I teach maths. My wife, a much more visual and creative person than I, has always thought of it as a star.

Same object, different perceptions.

How did you describe it – as a red star or the number thirteen?

It’s a good job opposites attract!

Posted in Uncategorized | Comments closed

How did I do?

Football goal

Back in this post, way back in August at the start of the football season, I wrote of how I was predicting the outcome of the Premier League and would compare my predictions with the actual finishing places using Spearman Rank Correlation Coefficient.

So now the last ball has been kicked, the champions crowned and the relegated commiserated, how did I do? I fired up Excel entered my predictions and the actual finishing positions of all the teams and calculated that “my” Spearman Rank Correlation Coefficient was 0.768. 1 is perfect correlation (i.e. my predictions would have exactly matched the positions) -1 is the lowest possible correlation and would mean I had predicted the reverse of the table.

My score wasn’t too bad – I beat the BBC’s predictions – but I doff my cap to www.football.co.uk who came top in my comparisons with a Coefficient of 0.832.

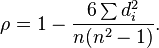
Here’s how you calculate Spearman Rank Correlation Coefficient:

Spearman's rank correlation coefficientBut as ever, statistics always seems to pose more questions than it answers.  Which teams were most and least predictable?

I took the data I had and found the difference between their actual finishing position and their predicted finishing position.  I squared this difference (to make all the differences positive) and summed these differences.

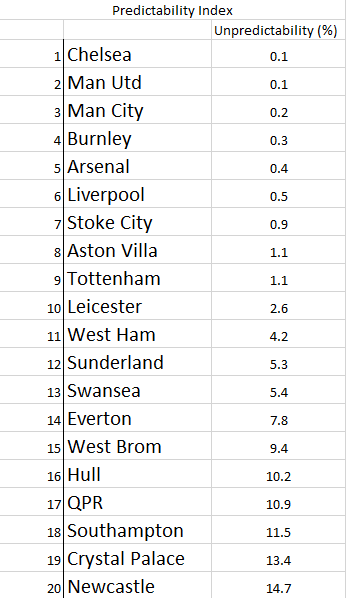
This led to an interesting alternative league table of predictability.  Chelsea topped this table – most had predicted them to be Champions or runners up.  Man. City & Utd also finished near the top of this league as did Burnley – most people predicted them to finish at or near the bottom, and they did. Newcastle, Crystal Palace and Southampton found themselves at the bottom of my predictability league, suggesting that they either over or under performed this season.

You can see my “Predictability Index” League below.


Predicatbility Index 2014-15 Season

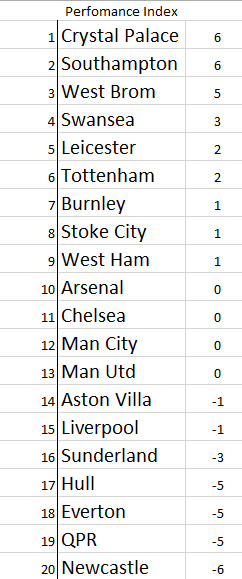
Another interesting stat to consider may be to calculate an over/under perform table -here I found the average of the difference between where a team was predicted to finish and where it actually finished. A positive number suggests a team over performed against expectations, a negative value represents under performance.

Performance Index

All fascinating stuff – I’m looking forward to the new season already!

Posted in Handling Data | Tagged , , | Comments closed