Photo by Matthew Wilkinson / CC BY 2.0
Spearman’s rank correlation coefficient, and other ways to use football to teach maths
A new season kicked off at the weekend and I’ve been thinking of ways to “use” the Premier League in my teaching.
This year I shall be teaching Statistics 1 A & AS level module which (for my board, OCR) includes using the Spearman rank correlation coefficient, which is used to see if there is a link between two sets of data. I will get my pupils to predict the outcome of the league table, ranking the teams from first through to twentieth position. I’ll get them to do this sometime in September then file their predictions away until May – when the season ends. I’ll then get them to compare their predictions against the final league table using Spearman rank and we’ll see who made the best predictions in September. By May, my classes will have met Spearman’s rank correlation coefficient and it should prove to be a useful revision exercise.
To calculate the Spearman rank correlation coefficient, use the formula below. It looks a bit difficult, but its not – using it (if not understanding why it works) is not beyond a reasonable Year 9 or Year 10 pupil, and calculating it would provide some useful algebra-substitution practice so if you have a football mad class or pupil, why not set them the challenge to beat you in predicting the outcome of the league.
![]() In the above formula, n is the sample size (so 20 if you are ranking the league) and d is the difference between ranks. E.g. if you predict Arsenal will come 4th and they end up coming first, then d is 4 – 1 = 3.
In the above formula, n is the sample size (so 20 if you are ranking the league) and d is the difference between ranks. E.g. if you predict Arsenal will come 4th and they end up coming first, then d is 4 – 1 = 3.
Of course, I’ve made my own predictions and I’ve made a note of several predictions from newspapers, the BBC etc., and I’ll report back in May to let you know how I, and they, got on.
How many different ways could the league finish?
Whilst doing the above, I got to thinking: “How many different permutations* of the final league positions are there?”
I think that this could make a great investigation or extension puzzle, accessible to pretty much any good mathematician from, say, year 5 upwards.
After letting pupils muck about with the problem for a while, I might then suggest that they consider a simple league with, perhaps, 4 teams in it. Or can they make the problem even simpler than that?
Perhaps the easiest way to think of the solution is this:
There are 20 different ways of filling first place, then there are 19 ways to fill second, 18 to fill third and so on, so the answer is:
20 x 19 x 18 x … x 3 x 2 x 1 = 20! = a very big number!
*Ask your pupils to find out the difference between a permutation and a combination.
Two points for a win instead of three
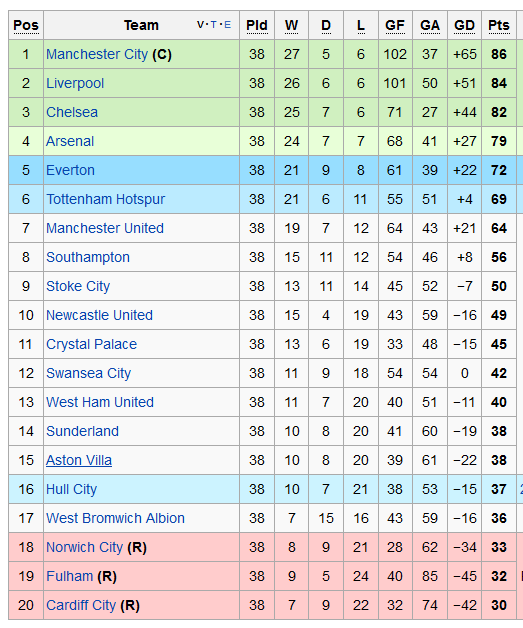
Those of you who are as old as me will remember that, before 1981, teams got two points rather than three points for a win. The points system was changed to encourage more open attacking football as win became more valuable. But it poses the question – would the final table have been different last season if we reverted to the old system of two points for a win? Below is a copy of how the table finished last season – get your pupils to calculate the final points for each team if they only got 2 points for a win instead of 3? Does it change any team’s final position?
