And so, with a moth invasion rather than a pitch invasion, the Euro 16 competition has come to an end, with Portugal claiming the crown of champions with an extra time winner. Not many predicted them as tournament winners, but then that is one of the beauties of the beautiful game, its unpredictability: “Favourites win less often in football than in any other sport.”
So how did the twenty four teams involved in the competition fair compared to their official FIFA rankings?
Not too well. Or more correctly, there was little or no significant correlation between FIFA ranking and final Euro 16 position.
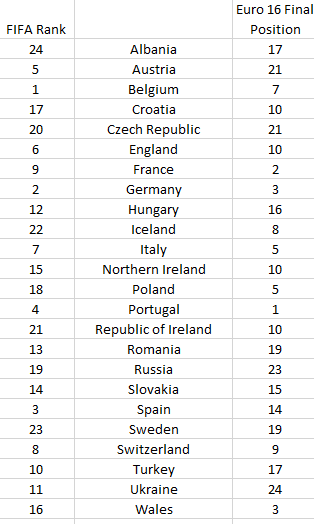
What I did is I looked at the FIFA rankings and ordered the teams in the tournament from 1 to 24 based on this. For example, Belgium are ranked 2nd by FIFA, but they were the highest ranked team in the tournament, hence I put them at the top the FIFA list. Some other interesting listings: England were the 6th best team in the competition, Northern Ireland 15th, Wales 16th and the Republic of Ireland 21st according to their FIFA rankings. Eventual winners Portugal were ranked 4th best out of the 24 teams taking part.
I then found each team’s final place in the competition. Some were obvious: e.g Portugal 1st, France 2nd etc., for teams eliminated in the knockout stages I ranked teams beaten more heavily lower than those who lost by a goal, and even lower than those who lost but took the game to extra time. For example, looking at the losing quarter finalists, I ranked both Poland and Italy joint 5th place as they both lost in extra time, Belgium 7th as they lost by 2 goals and Iceland 8th as they lost by 3 goals etc.
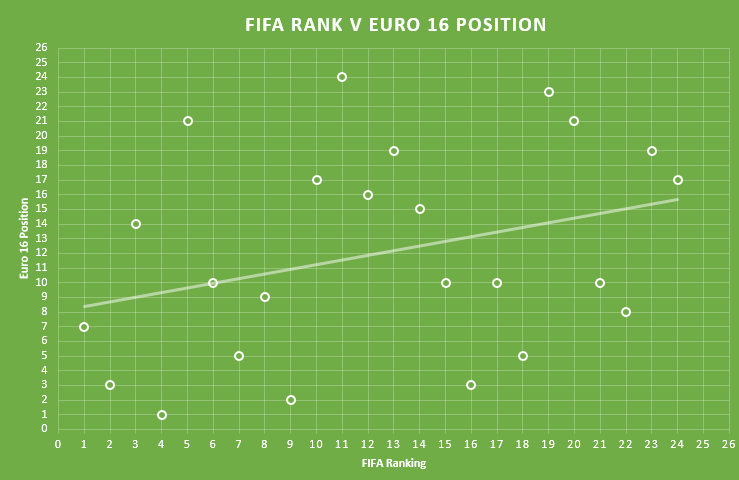
I then found the Spearman Rank Correlation Coefficient to compare the FIFA ranking and the final Euro 16 position and it came outs as 0.315
… and that’s not a lot.
It can have a value of anything from between -1 to 1 and we would be looking to get a value in excess of circa 0.65 to suggest, with confidence, that there was any meaningful correlation between the two sets of data. You can see from the graph above that we can draw a line of best fit, but the points are all someway from that line. At GCSE level maths we would draw the line by eye and would make a statement like “there is weak (or no) positive correlation.”
By the time we reach A Level maths we begin to quantify our results and Spearman Rank is one way to do it for this set of data, and we would be expecting students to make a comment on their results. (At A Level, we would use something called linear regression to draw our line of best fit.) I would expect an A Level student to conclude that there is no meaningful correlation between FIFA ranking and where a team finished in Euro 16.
So what does this mean? Are FIFA’s rankings useless?
Not necessarily. It could just be another indication of the unpredictability of football, or it could be that the rankings are useless, but more likely a combination of both, and does a tournament really tell us which is the best team? Not many pundits, players or fans would say, today, that Portugal are the best team in Europe, but they have just won the tournament. So how do we define what is the “best team”?
As ever, statistics seems to throw up more questions than it answers. But life would be boring, back pages blank and the airwaves silent if we all agreed and had nothing to discuss. And to be fair to FIFA, they will soon be publishing their new world rankings and these will include data from Euro 2016. All I can say, is don’t use those rankings to pick out the eventual winner of the next World Cup in 2018!

