What chance Brexit?
As the deadline date of March 29th looms ever closer, are we any closer to finding out what will happen?
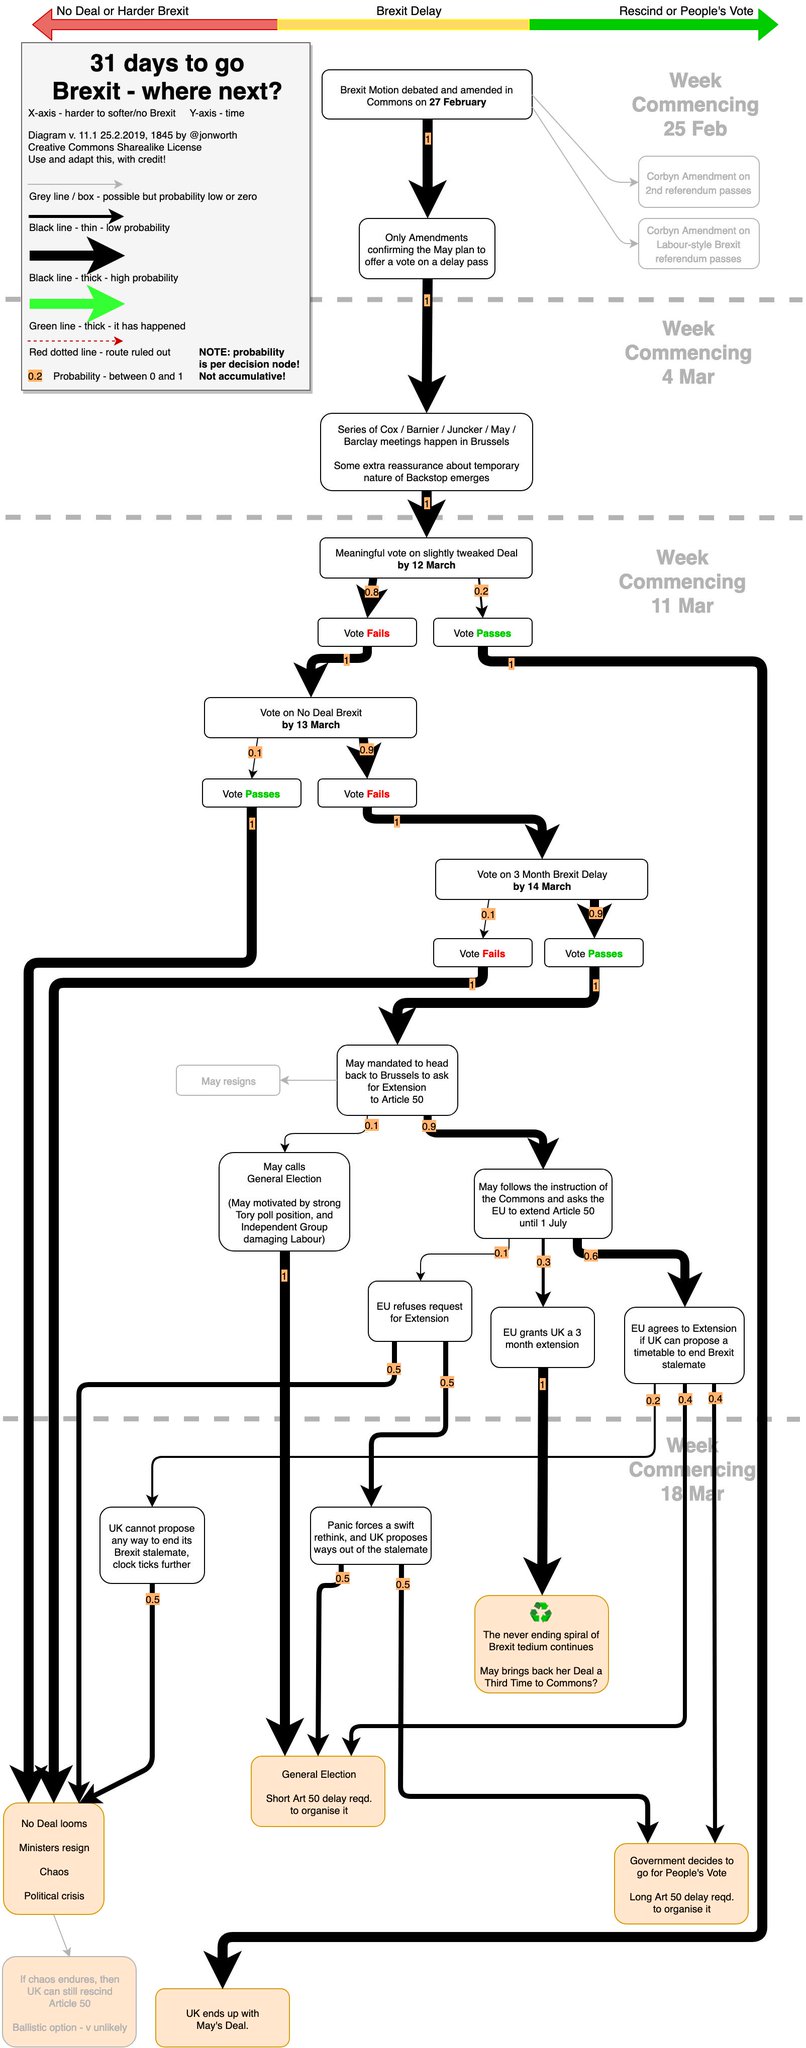
On his blog Jon Worth has produced an excellent flow chart where can follow all the possible twists and turns before ending at one of five possible outcomes. In addition to suggesting possible outcomes, he has added probabilities at each decision point.
Using nothing more than GCSE Maths*, it is then possible to calculate the probabilities of the various outcomes.
I’ve done the maths for you, the results are below (rounded to 2 decimal places)
- No Deal Brexit 0.25 (or 25% chance)
- General Election 0.22 (or 22% chance)
- Never ending spiral/May brings deal back to Commons for 3rd time 0.17 (or 17% chance)
- Peoples Vote 0.15 (or 15%)
- May’s Deal 0.2 (or 20%)
So, not much to pick between any of those.
Once again, many thanks for Jon Worth producing his flowcharts and sharing them (under creative commons sharealike license): Do visit his site : Brexit – Where now? The flowcharts and follow him on Twitter
*Although looking a little more complicated, this is no different from the decision tree questions when Bob & Linda play badminiton, familiar to many a Year 11 student. To find the probability of following a route to its conclusion, multiply all the probabilities along the path. Then add all the probabilities of the routes to that end to find the total probability of reaching that outcome. If unsure, ask a GCSE student – they’ll be able to explain!