The “10 Year Challenge” is the current rage on social media, whereby you are encouraged to post a picture of yourself from 10 years ago, alongside one from now, to see how you’ve aged.
I thought it would be interesting to see how the last ten years have been for the nation’s football teams.
I found their league position at the end of the 2008/09 season and compared it to their current* league position.
*before kick off, Saturday 19th January 2019.
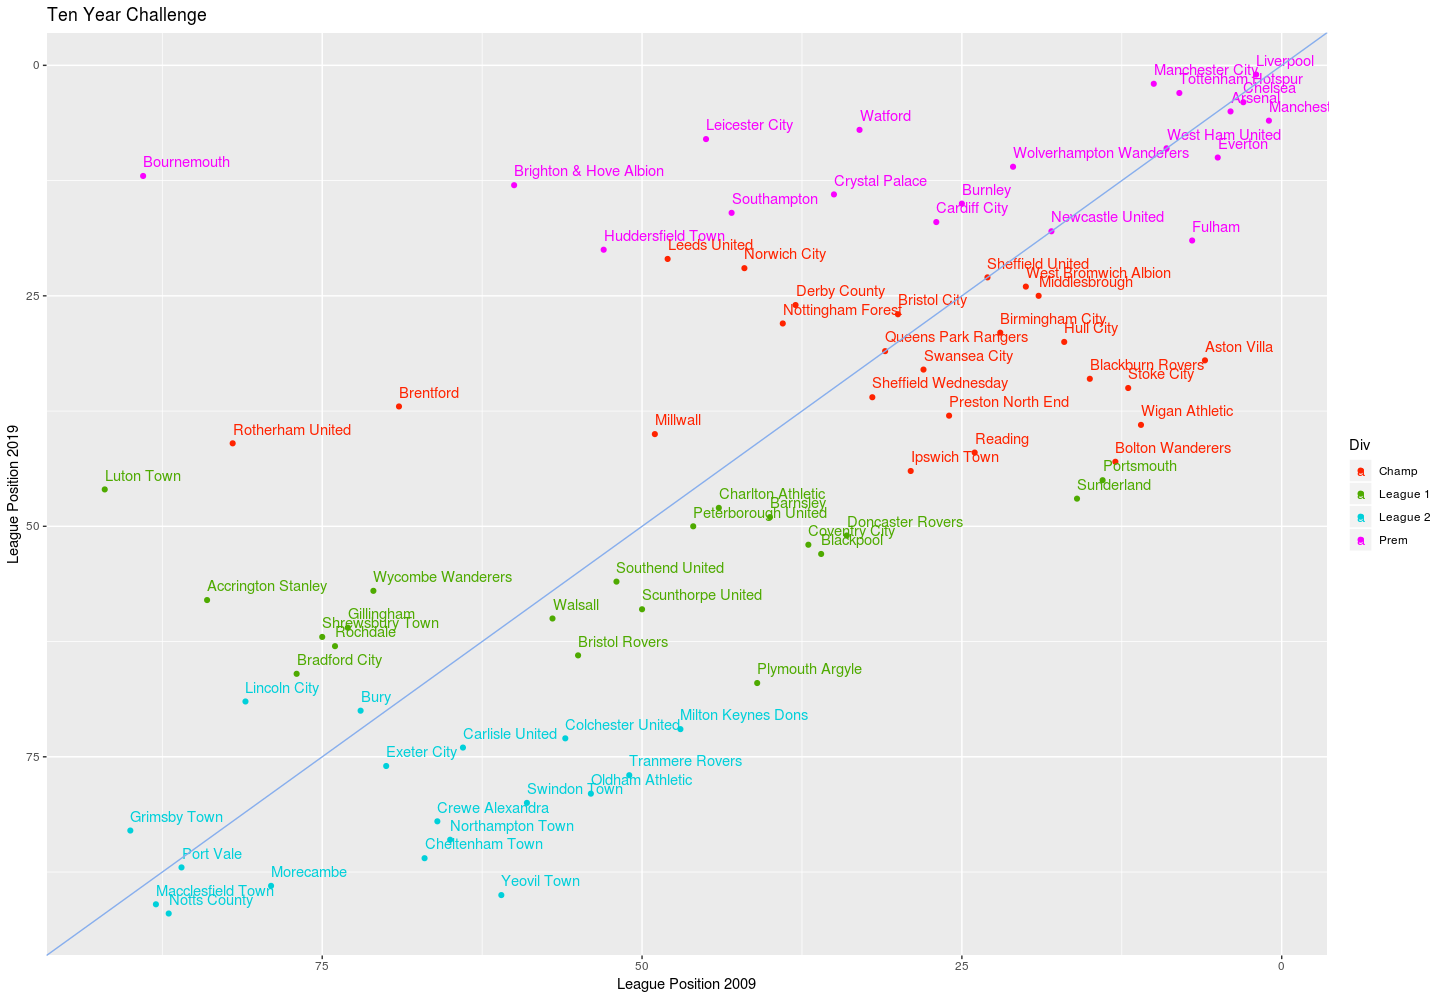
I’ve plotted the results above – those above the blue diagonal line are in a better place now than ten years ago, those below are now lower down the football league structure. The further from the line the better (or worse) a team has performed over those years.
I’ve reversed the direction of the x and y axis – it seemed more intuitive that way: the higher up the y axis, the higher your current league position (although a lower number e.g. Liverpool, who top the table on 19th January 2019, have a ranking of 1).
Winners and losers:
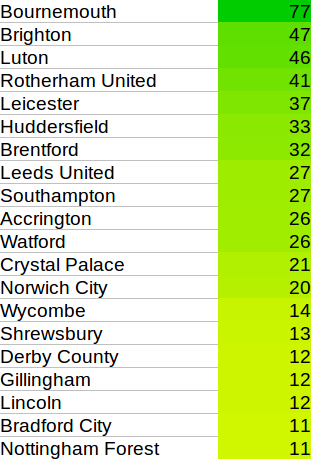
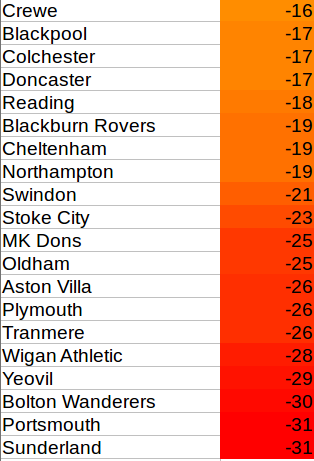
Bournemouth are the success story, a full 77 places above where they were ten years ago. Brighton are 47 places better off, all of which must be somewhat galling to their south coast cousins, Portsmouth who, along with Sunderland, have had the toughest ten years, slipping 31 places down the league ladder.
Same old, same old:
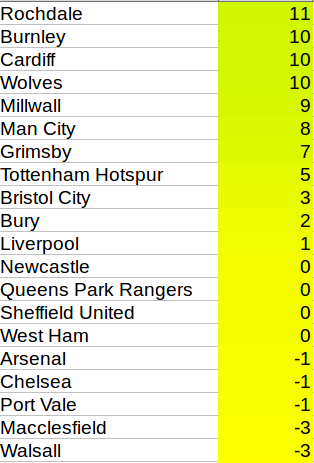
Four teams, Newcastle Utd., QPR, Sheffield Utd., and West Ham are in exactly the same place now, as they were ten years ago.
Gone, but not forgotten:
The observant amongst you will have spotted that there are not 92 clubs on the plot above. In that time ten clubs have been relugated from the league:
Aldershot Town
Barnet
Chester City
Chesterfield
Dagenham & Redbridge
Darlington
Hartlepool United
Hereford United
Leyton Orient
Stockport County
To be replaced by:
Burton Albion
Cambridge
Crawley
Fleetwood
Forest Green
Mansfield Town
Newport
Oxford Utd
Stevenage
Wimbledon
As ever, statistics only tell us so much, and end up posing more questions than they answer. What is the secret Bournemouth, Brighton, Luton & Rotherham’s success? I think it would be interesting to see if there is any correlation between length of tenure/number of managers and how well a team has fared? And if so, which is the cause and which the causation? Do managers stay because the team is successful, or is a team successful over the long term because the manager stays? Does geography have a part to play? What happens if we look at trends over twenty years, not ten?
So how has your team done over the last ten years?
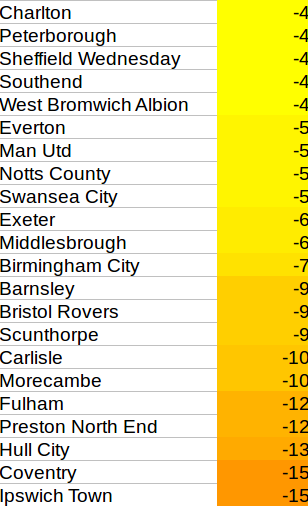
Below are some screen shots of the spreadsheet I used in my calculations. The number is the amount of places they have moved, positive is good, a negative number is how many places they have dropped.