We may be on the eve of the new domestic football season, but before we consign the World Cup, Russia 2018, to history, I just want to share this plot with you.
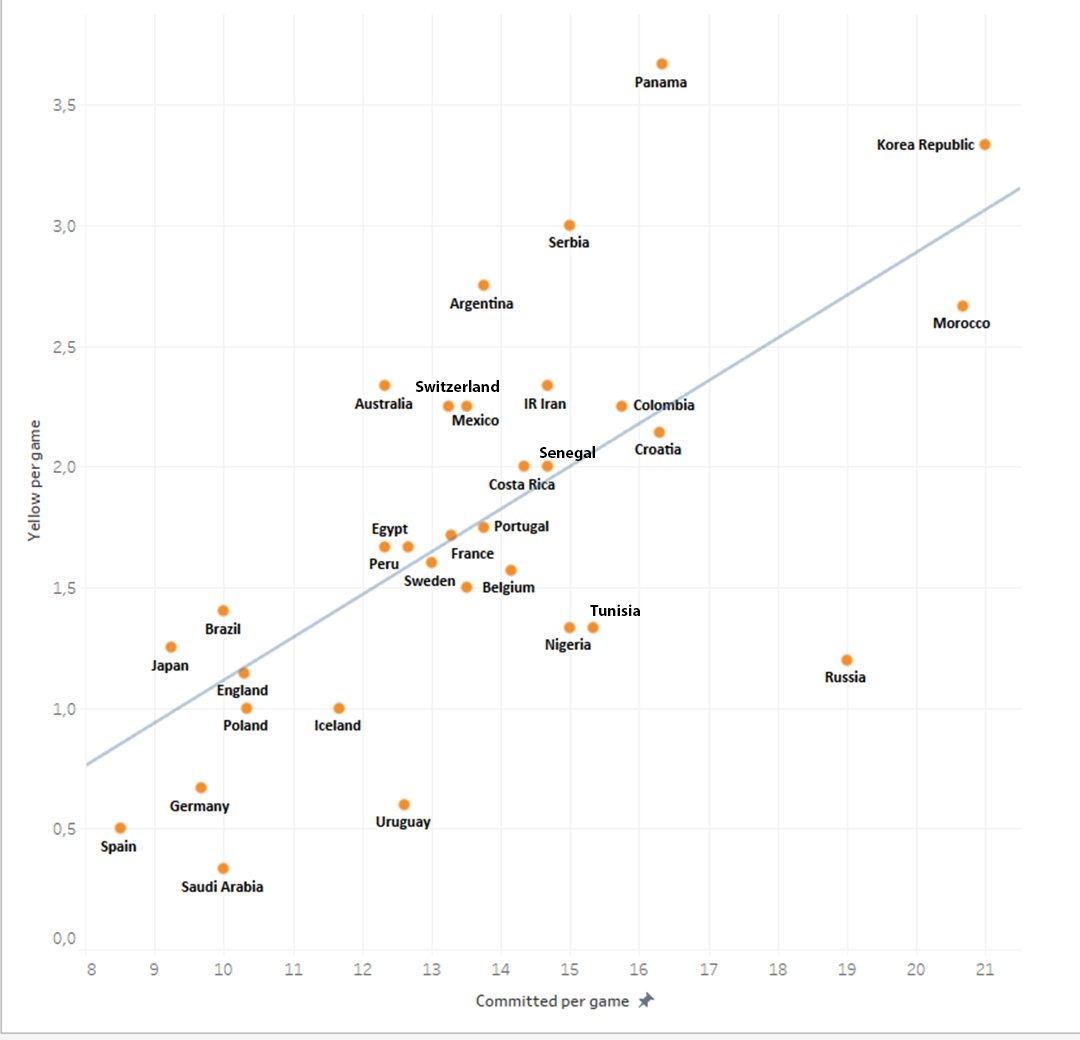
It compares the fouls committed per game by a team, and the number of yellow cards received.
By eye, there does appear to be some correlation between the number of fouls committed by a team and the amount of yellow cards they received. This would be expected.
The hosts, Russia, do appear to be an outlier – the third most fouling nation, yet their card count was low.
This could be for a number of reasons – e.g. if many of the fouls they commit were for, say, offside, you wouldn’t expect them to be receiving yellow cards for those offences. But everyone loves a good conspiracy theory – perhaps the refs, either intentionally or subconsciously, were a little more reluctant to flash their cards for the home team …
It prompts an interesting question to explore for the forthcoming season: do away teams get carded more frequently than home teams?
Many thanks to Answer Miner for creating and sharing the plot. You can see his original tweet with it here.