Some good news.
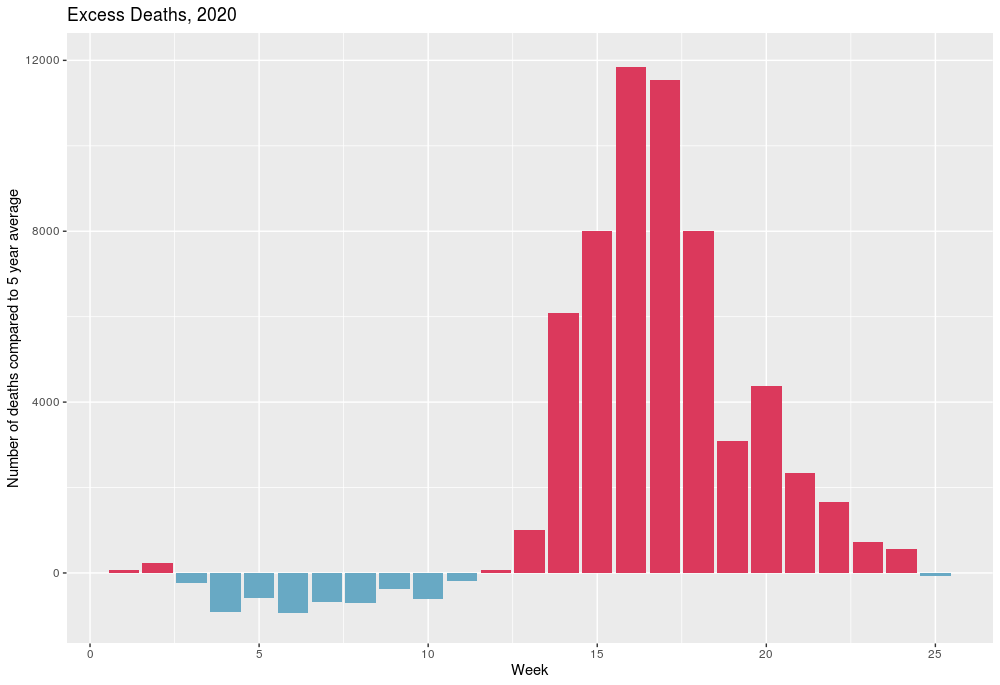
For the first time since mid-March, excess deaths are below the five year average. Regular readers will know that I have been tracking “excess deaths” (based on data provided by Office for National Statistics ) as it strips out any debate as to whether a death was due to Covid 19 or not. Instead, it compares the number of deaths in a week to the five year average for the equivalent week.
The graph above does not mean we are out of the woods yet (as I write, Leicester is being placed in to local lock-down to combat a regional spike) but it does give cause for hope.
(note: week 25 is the week ending 19th June 2020. Week 11 – the last time excess deaths were negative, was the week ending 13 March 2020)