Unprecedented yes, but unlikely?

“We live in unprecedented times” is, perhaps, a somewhat overused phrase of the last six months, but yesterday it was apt as the unprecedented happened.

In their match against Manchester United, Brighton and Hove Albion hit the woodwork* 5 times in the game. This (one team hitting the woodwork 5 times) has never happened before in a Premier League fixture.

(* “hitting the woodwork” in football is when you shoot, and the ball rebounds off either the posts or the cross bar. For the neutral spectator it is an exciting and dramatic moment as the ball cannons back – with an audible thud – onto the field of play. For the attacking side it is, of course disappointing as they hope, instead, to see the net bulge, whilst the the defending team breath a collective sigh of relief as a goal is thwarted.)

So how likely is this? Hitting the woodwork five times in a ninety minute game? Should we be surprised that it happened, or perhaps surprised that it hasn’t happened before?

On of my regularly readers, Steve from Cheltenham, got in touch with me to walk me through some maths he had done to calculate the probability of this happening:

Assume that every shot is always within a rectangle that extends to 1 metre around the outside of the goal (of course, this isn’t always the case, but we need to make some assumptions if we are to create a working model.)

Assume that there is no aiming and hence every point within that rectangle is equally likely to be hit (another assumption to simplify our model)

The total area of the aiming zone is 34.03 m2

The area of the posts and bars are not what you might first think …

In our initial work, we just found the area of the posts and bars, but this would assume we were modelling the ball as a point. But actually, the centre of the ball can miss the post, but the ball still strike it, so the effective width of each post is the 12cm of the post, plus x 2 diameters of the ball (the diameter of the ball is 22cm) Hopefully the sketch picture below adds some clarity:

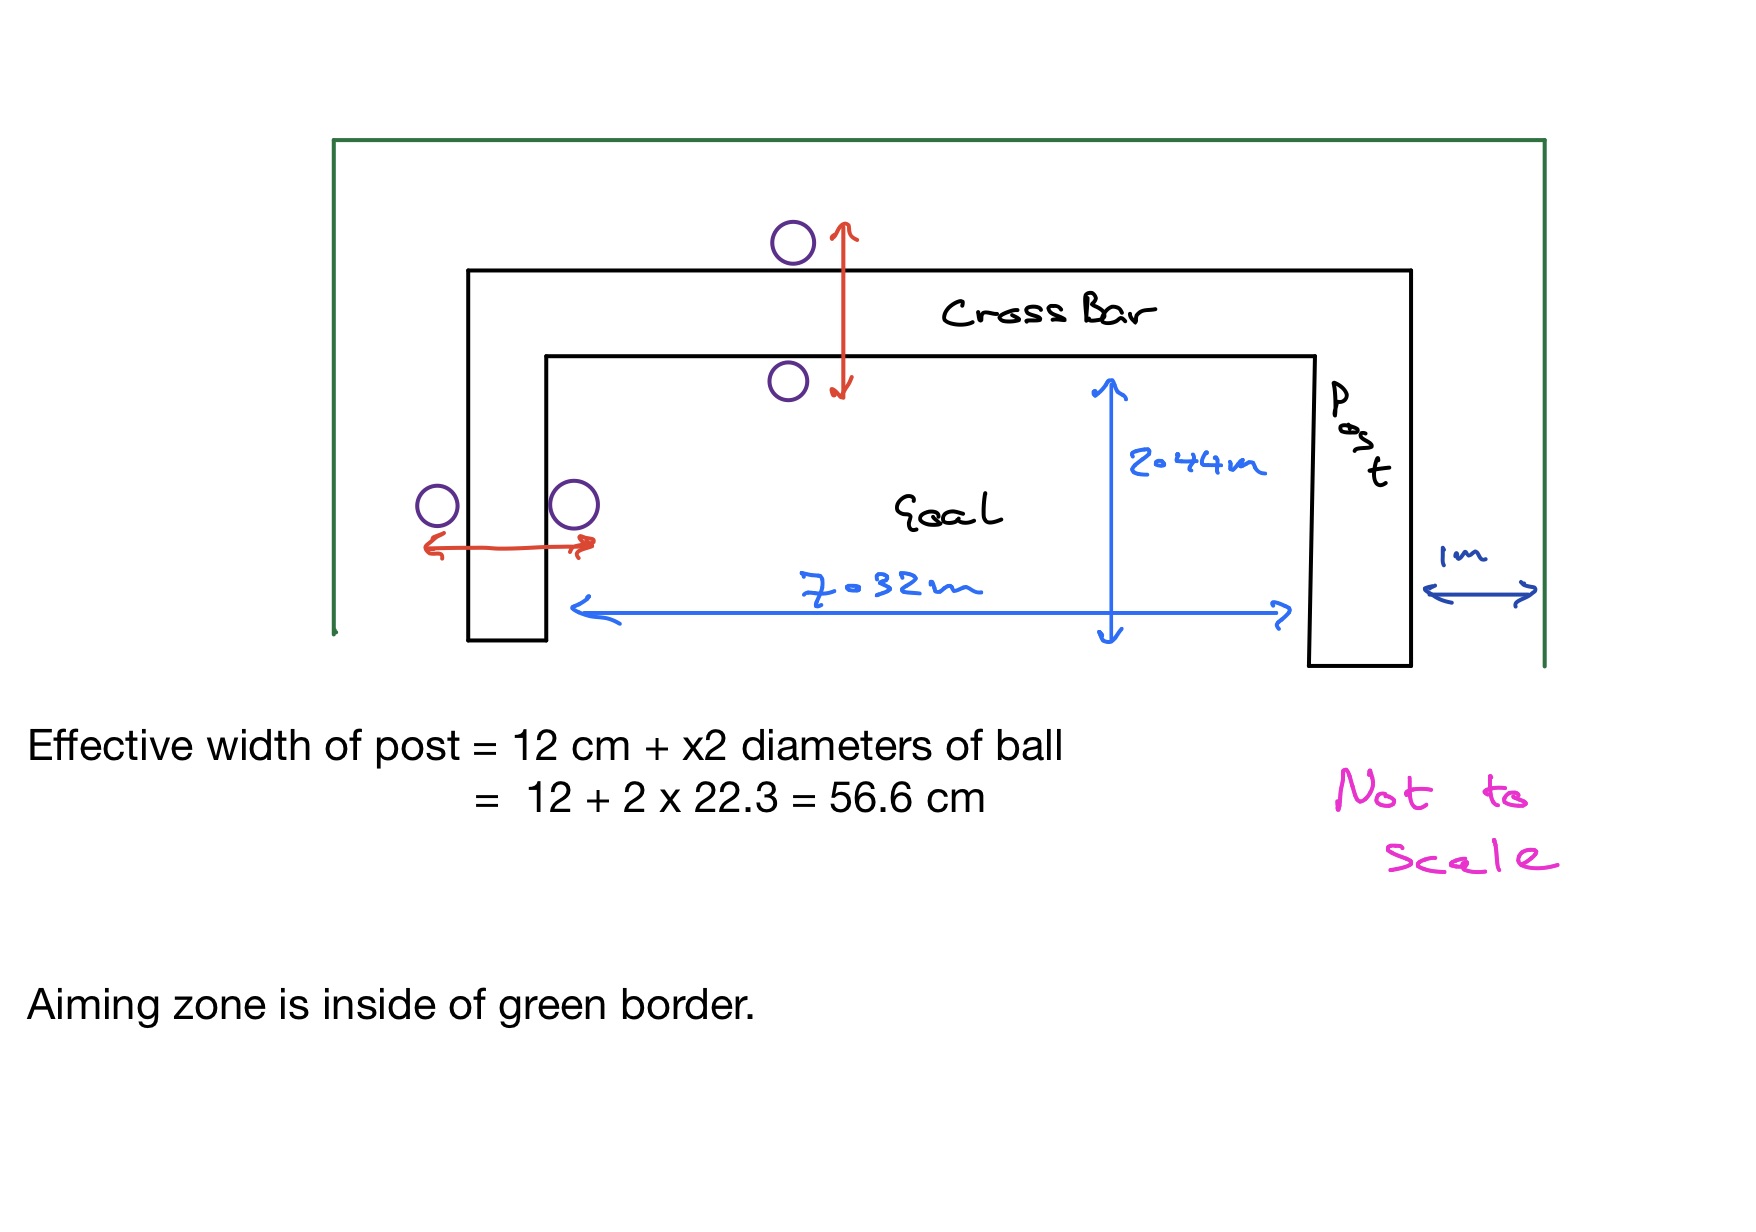
This make the “effective” area of the woodwork 6.83 m2

Therefore the probability of hitting the woodwork is 6.83/34.03 = 0.201 (to 3 decimal places)

Brighton had 18 shots in the match, so we can use a binomial distribution with n=18 and p = 0.201 to find the probability of hitting the woodwork in 5 out of those 18 shots.  Using the standard notation:

When B ~ (18.0.201), P(X=5) = 0.152

or, the probability of hitting the woodwork 5 times in yesterdays game was about 15%, so unprecedented, yes (because it hasn’t happened before), unlikely? yes, but perhaps not too surprising and maybe we should be wondering why we haven’t seen it happen before …


Posted in Handling Data, Probability | Tagged | Leave a comment

Lucky, or unlucky?

Whenever I see a clip like this my first reaction – like those in the car (and sorry for the NSFW language) – is how lucky the survivors are.

But then I begin to ponder.

Are they actually unlucky? What are the chances of being in the vicinity of a falling tree? Pretty low, I suspect.

So whilst you might count the pedestrians as being lucky to avoid being crushed by the tree, they are also pretty unlucky to be so close to a tree as it gets uprooted by the wind.

Alas, I lack the mathematical skills to determine an answer to this question so (for me at least) it will remain a philosophical question.

Lucky or unlucky – what do you think?

Posted in Probability | 1 Response

Covid 19 stats, part 4

Some good news.

For the first time since mid-March, excess deaths are below the five year average. Regular readers will know that I have been tracking “excess deaths” (based on data provided by Office for National Statistics ) as it strips out any debate as to whether a death was due to Covid 19 or not. Instead, it compares the number of deaths in a week to the five year average for the equivalent week.

The graph above does not mean we are out of the woods yet (as I write, Leicester is being placed in to local lock-down to combat a regional spike) but it does give cause for hope.


(note: week 25 is the week ending 19th June 2020. Week 11 – the last time excess deaths were negative, was the week ending 13 March 2020)

Posted in Uncategorized | Leave a comment

Covid 19 stats, part 3

I continue to crunch the numbers, and explore different ways to display the data.

In the graphs above, I have taken the total number of weekly deaths in England and Wales (as reported by Office for National Statistics) and subtracted from that the average number of deaths for that week.

Before the outbreak of Covid 19, 2018 had been a “bad year” for deaths, with the weekly death rate often being above the 5 year average (see graph of cumulative deaths, below) so I plotted that – on the same scale – to make an easy comparison with the tragedy of this year.


Posted in Handling Data | Leave a comment

Covid 19 stats, part 2

Data can tell us many things, but we need to understand what data we are looking at, and what the data is showing us. As the Covid crisis has continued, there has been debate and discussion about how many deaths are due to the disease.

The government, daily, discloses the number who have died in hospital from Covid-19, but this only tells part of the story as many are dying from the virus in care homes and, possibly, at home.

How do we know the true impact the virus is having?

One way is to look at total deaths per week, and compare them to equivalent weeks in years gone by.

The data is all available at the Office for National Statistics  and I’ve used the data to generate the graphs above.

Its quite clear that, whilst there is variation from year to year, the trend for each year is similar.

Until you reach week 13 of 2020 (week ending 27 March) when the line takes a sinister upwards turn, and does not stop its climb.

By the week ending 17 April 2020 (the last week data is currently available) more than 22 thousand people in England and Wales died in that week, circa 12 thousand more than the average for that week.

12,000 excess deaths in one week alone. A sobering reminder of the deadly effect of the corona-virus.

Posted in Handling Data | Leave a comment