Covid 19 Stats

The unfolding tragedy that is Covid 19 is being fought on many fronts, and data, statistics and mathematics are playing a strong supporting role, by helping to inform what is happening and allow the scientists and politicians make decisions and review the outcome of the policies that have enacted.

Much data is being made publically available, and I have been experimenting with a new tool I have found to display that data. Whilst not up there with some of the excellent graphs and infographics being produced by many sources, I’m quite pleased with what I have achieved. Later this term, I will be teaching (remotely) some of my students how to access the data and use various tools to visualise and interpret said data.

I needed somewhere to host my first couple of forays in this field, so here they are.

Data sources:

Our world in data

Office for National Statistics

Worldometer

Posted in Handling Data, Large Data Sets | Leave a comment

The Good, The Bad and The Ugly

This cartoon is good. Very Good.

(FWIW, I definitely identify as a Pythagorean rather than a Trigonometric)

It came from “The Saturday Paper”, an online Australian newspaper. Here is a link to the original cartoon, and the paper.

And now we contrast it with something that is both bad and ugly. It is perhaps no surprise that this monstrosity comes from Fox News. Just look at that y-axis (if you dare) and weep.

Now go back up to the top of this post and look again at the brilliance of that cartoon. Hopefully it will erase the memory of that shockingly bad graph,

Posted in Maths Fail | Leave a comment

VAR for the classroom

We live in strange times, very strange times.

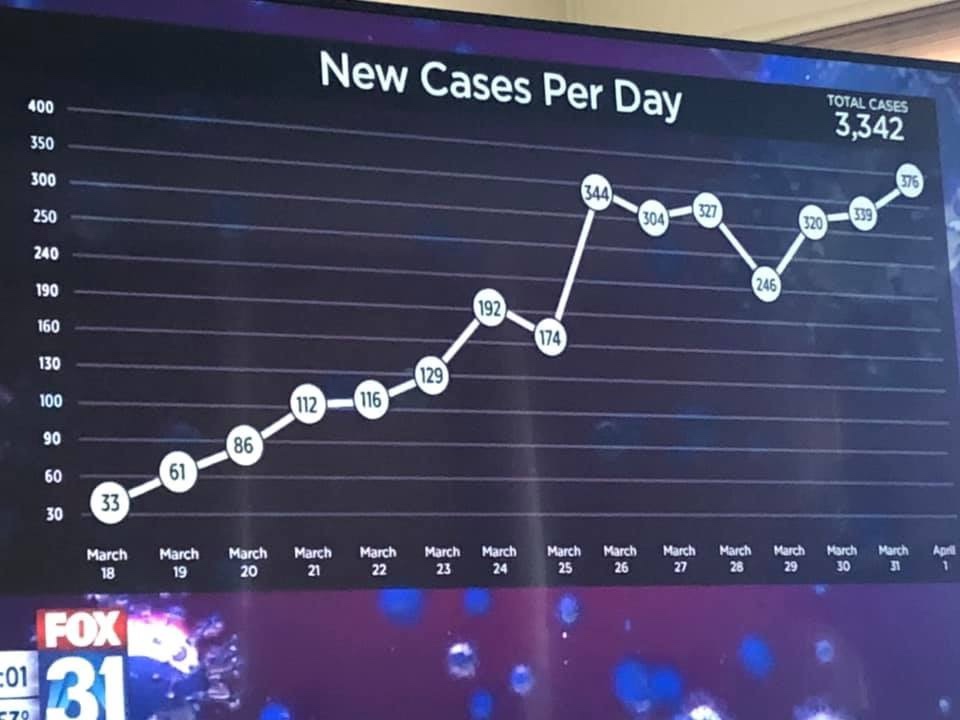
Due to the Corvid 19 pandemic, on Friday all schools shut.

The writing was on the wall from the start of the week and I began to “upskill” myself rather rapidly, to enable me to continue to teach remotely.

I am lucky – I teach in a well resourced and technically advanced school and, perhaps more importantly, I have a great Year 10 class. I devoted our lesson on Monday morning to seeing what worked, and how to use it. Having these digital natives around certainly helped to teach this old dog a plethora of new tricks.

I’ve now got a system up and running that works well – based around Microsoft Teams, I create a meeting and my class all join. We don’t use video (it can slow things down – at least that’s what I tell them. In reality, no matter at what angle I have the camera on my iPad I am greeted with an image of myself with several double chins.) However, we can all hear each other and the students can see my screen – either my interactive whiteboard, or an app on my iPad. It is a good system and I’m pleased with the results. Later in the week a ran a lower sixth class with some students physically in the room with me and a number who weren’t, and it was a seamless experience.

With a click of a button, I can record the lesson as it progresses, thereby making it available for review by students after the event, if they didn’t understand something or couldn’t make the lesson at the time.

But, more importantly, the recording gives me VAR for the classroom. No more “it wasn’t me, sir”, a quick check of the monitor (or with the TMO for our egg-chucking friends) and out comes the yellow card.

My classes have never been so well behaved!

Posted in Teaching Tips | Leave a comment

Rice (& Jeff Bezos’ Billions)

In several of my recent posts, I’ve looked at some unusual units for measuring volume, area and mass, so I was delighted to stumble across these two short videos that illustrate BIG numbers using rice, and thinking about money, and Jeff Bezos’ billions in particular.

They won’t take long to watch, but illustrate the point far better than words ever could, so I’ll stop typing now and let you click play.


@humphreytalksThis took me hours don’t let it flop ##billion ##money ##personalfinance ##rice ##xyzbca♬ original sound – humphreytalks


@humphreytalksRice. Part 2: Jeff Bezos net worth. ##rice ##billion ##billions ##amazon ##jeffbezos ##money ##personalfinance ##xyzcba♬ original sound – humphreytalks

Posted in Numeracy | Leave a comment

Wales, Boulders and car parking spaces

In a couple of recent blog posts I have written about unconventional units – such as boulders to measure mass or volume,  and football pitches and Wales to measure area.

I’m delighted to report another use of an unconventional measure, and this time from the esteemed body that is the  Office for National Statistics.

In a recent blog post they discuss the floor space of houses and flats. They tell us the median floorspace of a house in England and Wales is 99 square metres, and that of a flat is 43 square metres.

But what does 99 m2 look like to you? Do you have a real, tangible concept of what that measurement means?

I don’t.

But helpfully, the nation’s official statisticians have recognised this and compared the floor span of a house in England to about 9 car parking spaces, and that of a flat to 4 car parking spaces.

(From the data given, you can deduce that a car parking space can be approximated to 11 square metres.)

Everyone probably has a good sense of the size of an average car parking space, so a useful additional unconventional unit to add to our collection.


Posted in Handling Data, Shape and space | Leave a comment