A large boulder …

In this post I wrote about using unconventional units of measurement, such as using football pitches or Wales to measure area, or Double Decker Buses for height & volume, the blue whale for mass etc.

But, crucially, I omitted a vital measure of volume: the small boulder.

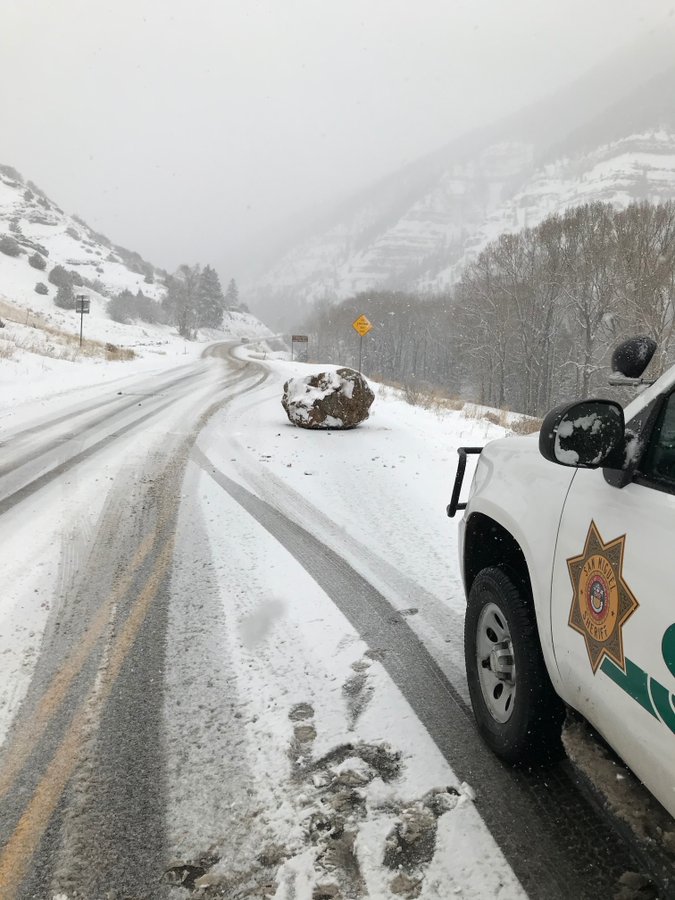
In, perhaps, the best tweet of the day, The San Miguel Sheriff wrote:

Large boulder the size of a small boulder is completely blocking east-bound lane Highway 145 mm78 at Silverpick Rd. Please use caution and watch for emergency vehicles in the area.

As one wag pointed out, a large boulder the size of a small boulder must surely be an average sized boulder.

Fortunately, the Sheriff in a later tweet, confirmed that the boulder had been moved and, more importantly, gave its dimensions as:

The boulder that fell onto Highway 145 at Silverpick Rd outside Telluride was approximately 4ftx4ftx4ft (64 cubic ft) and weighed about 10,000lbs.

So now we are able to quantify the “small boulder” unit.

By my calculations, 60 small boulders have the same volume as Double Decker Bus, and 20 small boulders weigh the same as one blue whale.

Important stuff.


Posted in Shape and space | Leave a comment

Best Use of Maths award, 2019

Throughout 2019, maths has been used in a multitude of manners, and the world in which we live would be very different without the application of mathematics.

But one use of the subject stands out above all others, and is worthy of a “Best Use of Maths 2019” award.

The comedian – and now mathematical hero – Joe Lycett correctly complained to Pot Noodle about their misuse of percentages and ratios when comparing their regular and king-sized pot noddles and, specifically, how their sachet sizes did not scale up alongside the noodle content. Important stuff.

Here is Joe’s letter to Pot Noodle:

To be fair, Pot Noodle took the request with good grace:

So, well done Joe, and Thank You.

The next time a student asks “what’s the point of maths” I shall show them this, how you used maths to take on the food giants and won, fighting for the rights of Pot Noddle eaters the world over.

An award well deserved.

Posted in Maths Fail | Leave a comment

Wales replaced by football pitches

“About the area of Wales …” 

Wales has often been used as an informal measurement of area, but in the Royal Statistical Society Statistic of the decade, they have forsaken Wales as an area of measurement, replacing it with (the much smaller) football pitch.

The estimated accumulated deforestation of the Amazon rainforest, over the past decade, is equivalent to around 8.4 million football pitches

Perhaps it is the international nature of the statistic that makes the football pitch a better choice of unit for this statistic, or perhaps it is the staggering number of “football pitches” that have been de-forested (although there is the danger that when we start to talk of big numbers, we lose context and understanding. Can you really visualise the difference between, say, 8.4 million football pitches, and 84 million pitches – a difference by a factor of ten, but for most of us both numbers are just “really big.”)

I did some back of an envelope calculations* and arrived at the conclusion that 8.4 million football pitches is about the same area as 3 Wales. So a staggering amount of deforestation – an area of the Amazon rainforest, equivalent in area to 3 times the size of Wales, has been de-forested this decade.

For reference, other useful alternative units of measurement include the Double Decker Bus (volume and height), Olympic Sized Swimming Pool (volume), Nelson’s Column (height), Blue Whale (mass) – I’m sure you can think of others (and I’d love to hear them)

*If you vaguely enjoyed reading this post, can I recommend this book by Rob Eastaway:


Image from Wikimedia Commons under Creative Commons Attribution Share Alike 3.0

Posted in Handling Data | Leave a comment

Stats of the Year 2019

Regular readers will know that I like my stats.

I like them because they, sometimes, confirm what we suspect or, because, sometimes, they tell us things we didn’t know.

And I particularly like them not because they answer a question, but they typically prompt another question – why?

Today is an important day. Today is the day that the Royal Statistical Society have announced their Statistics of the Year for 2109.

The winner of the UK Statistic of the Year is:

58% – the proportion of those in relative poverty who live in a working household.

Take a moment to ponder that. Over half of those living in relative poverty in the UK live in households were (at least) someone works. One could coin a phrase: “Work doesn’t pay.”  In the 1990’s, policymakers were seriously concerned about the number of households in which no-one worked. That number has fallen, but the stat above suggests that work/employment may not be the route out of poverty that it should be.

The International Statistic of the year is somewhat more positive.

The global life expectancy of a child born in 2019 is now 72.6 years. Compare this with the global life expectancy of 45.7 years for a child born in 1950. We often see stats about life expectancy in individual countries, but it is heart warming to see this stat which relates to all of us in this earth.

Seeing this stat, I was reminded of one of my statistical heroes – Hans Rosling – and I think he would have been cheered to see this stat. (I have written a couple of blog posts about Hans Rosling – you can see them here, and here.)

Down 28.8%

Highly commended was that stat that tells us that the average sugar content of a fizzy drink has been reduced by 28.8% following the introduction of the sugar tax – a number that far exceeds the reduction in sugar where a voluntary approach (eg breakfast cereals) has been taken. An example of legislation having a positive impact.

10.3%

Another “highly commended” statistic that tells us that more than one in ten of new cars registered in the UK are now electric and/or hybrid models.

Before I sign off, a quick shout out and thank you to the Royal Statistical Society for introducing and promoting the statistic of the year – the award is now in its third year. (In case you missed it, the statistic of the year 2018 was that a staggering 90.5% of plastic waste has never been recycled.)

For my fellow maths teachers – do consider joining the Royal Statistical Society (as a teacher you can join for free!) Click here to see the membership options.

Posted in Handling Data, Large Data Sets | Leave a comment

General Election 2019 in 3 charts

Whether or not it gives us a good government is a question I leave for you. But what a general election does give us is data and I like data.

So I crunched some numbers and came up with the three charts, above. I haven’t included any numbers as I quite like the aesthetic look of the charts and I think (hope) that they are fairly self explanatory.

What they do show is how many more votes the Green Party and (to a lesser extent) the Lib Dems needed to secure each of their seats compared to most other parties. I did run a plot to look at how the seats would be distributed under Proportional Representation, but the chart was the same as the “Number of Votes” chart. A moments thought and it dawned on me that this was to be expected. On these numbers, the Greens and Lib Dems would be the big winners under a PR systems, whilst the Conservative Party, along with the “regional parties” – SNP, Sinn Fein, DUP & Plaid Cymru – would all find themselves with fewer seats. Interestingly, the Labour Party would have 6 more seats had this election been run under PR.

I was originally going to produce the data a pie charts, but they didn’t render well my stats package (ggplot in RStudio), unlike the bar charts above. (Sorry – got a bit geeky there for a moment.)

In researching this post, I found that all data from General Elections from 1918 can be accessed via The House of Commons Library 

To access the data set, click on this link, then scroll to the bottom of the page to find “Supporting Documents” and the data can be downloaded as an Excel spreadsheet

Posted in Large Data Sets | Leave a comment